Fig. 11
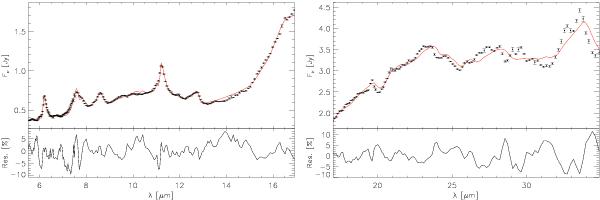
Fit of the Spitzer IRS spectrum of HD 155448 C. The points in the upper panels represent the Spitzer data, while the overplotted continuum line is the fitted model. See Table 8 for the individual contributions of the model dust species. The residuals of the fit are shown in the lower panels. The quality of the fit is good in general; however, there are mismatches between our model and the observed spectra. In the 5–17 μm region most of the mismatches are related to the strong PAH emission features. For the 17–35 μm region the mismatches are instead caused by differences in the peak positions of the strong crystalline silicate bands between the model and the observed spectrum.
Current usage metrics show cumulative count of Article Views (full-text article views including HTML views, PDF and ePub downloads, according to the available data) and Abstracts Views on Vision4Press platform.
Data correspond to usage on the plateform after 2015. The current usage metrics is available 48-96 hours after online publication and is updated daily on week days.
Initial download of the metrics may take a while.