Free Access
Fig. 2
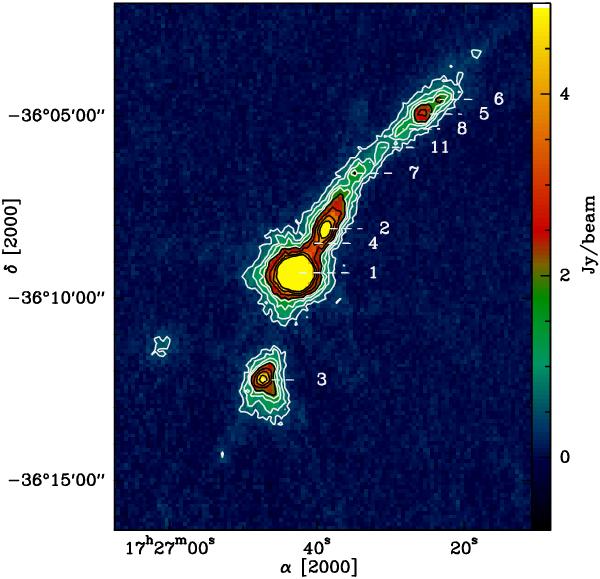
LABOCA map of the 870 μm dust continuum emission from the IRDC G351.77–0.51. The white contours are from 5σ (0.425 Jy/beam) to 2 Jy/beam in steps of 5σ; the black contours are from 2 Jy/beam to 5 Jy/beam in steps of 10σ. The numbers label the clumps found by the CLUMPFIND procedure and discussed in the text (see Table 3).
Current usage metrics show cumulative count of Article Views (full-text article views including HTML views, PDF and ePub downloads, according to the available data) and Abstracts Views on Vision4Press platform.
Data correspond to usage on the plateform after 2015. The current usage metrics is available 48-96 hours after online publication and is updated daily on week days.
Initial download of the metrics may take a while.