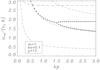
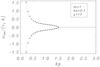
Fig. 5

Dispersion diagram plotting ω/(vlk) against kp for the values of the parameters shown in the legend. The upper panel represents the real part of the frequencies and the lower panel the imaginary part. Stable solutions are plotted in solid lines, while unstable solutions are plotted in dotted lines. The dashed line represents the external cut-off frequency (Eq. (46)), while the dot-dashed lines represent the position of the accumulation frequencies of each band (Eqs. (35), (36)). Only the modes that go through the bifurcations have been plotted. The results of the algebraic equation in Eq. (69) have been overplotted as dots.
Current usage metrics show cumulative count of Article Views (full-text article views including HTML views, PDF and ePub downloads, according to the available data) and Abstracts Views on Vision4Press platform.
Data correspond to usage on the plateform after 2015. The current usage metrics is available 48-96 hours after online publication and is updated daily on week days.
Initial download of the metrics may take a while.