Fig. 6
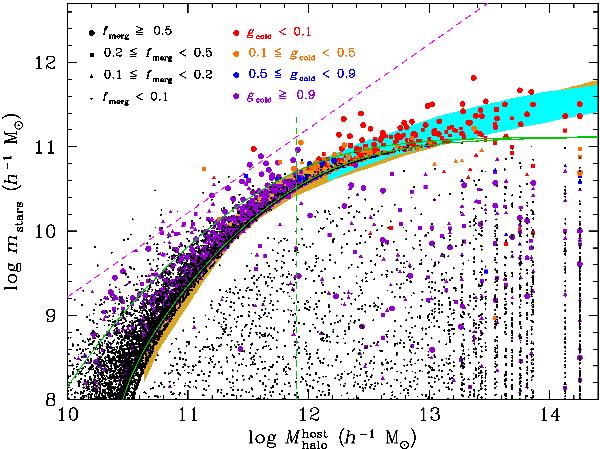
Galaxy stellar mass vs. host halo mass at z = 0 for the set of parameters (Table 1) that fit best the galaxy stellar mass function. Each point is one of our simulated galaxies. The symbol sizes and colours vary with the fraction fmerg of mass acquired in mergers, and the fraction gcold of this mass acquired by cold-mode mergers (where the sum of the masses of the haloes of the merging galaxies is below Mshock), respectively, according to the legend. The vertical green line corresponds to Mhalo = Mshock, while the oblique magenta line indicates mstars = fb Mhalo. The green curves show the stellar masses of galaxies acquired through the accretion channel (Eq. (8) with best-fit parameters from Table 1) at z = 0 (lower) and z = 3 (upper curve). The shaded cyan and gold regions correspond to the observations from the SDSS (Yang et al. 2009), and the halo-galaxy abundance matching of Guo et al. (2010). For the latter, the halo masses were shifted by log 10h to conform to our units. Also, the stellar masses were shifted by − log 10h and log 10h for Yang et al. and Guo et al., respectively, to take into account the different units with h. We also shifted the stellar masses by an additional factor of +0.1 and + 0.15 dex to pass from the Kroupa and Chabrier IMFs, respectively assumed by Yang et al. and Guo et al. to the diet Salpeter IMF assumed by Bell et al. (2003), on whose mass function we have calibrated our model.
Current usage metrics show cumulative count of Article Views (full-text article views including HTML views, PDF and ePub downloads, according to the available data) and Abstracts Views on Vision4Press platform.
Data correspond to usage on the plateform after 2015. The current usage metrics is available 48-96 hours after online publication and is updated daily on week days.
Initial download of the metrics may take a while.