Fig. 4
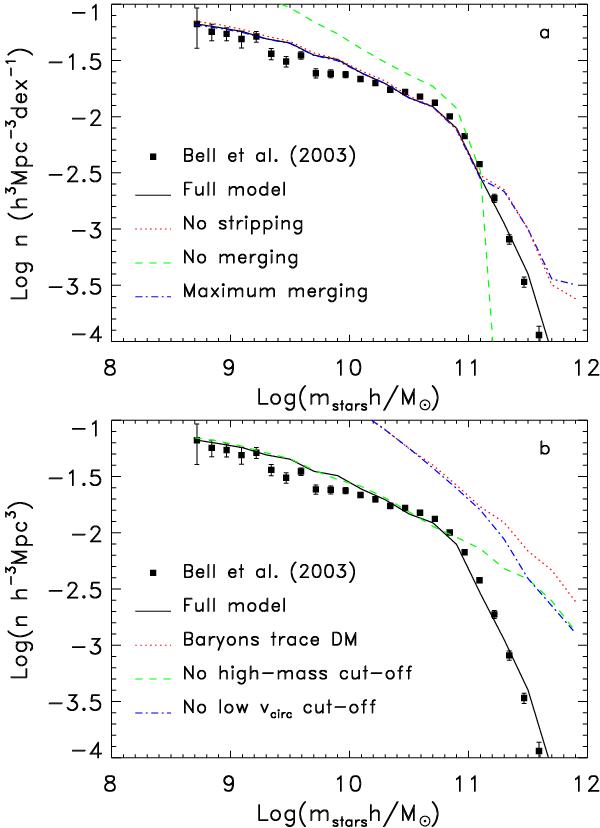
Stellar mass function of galaxies at z = 0. The filled squares show the galaxy mass function determined observationally by Bell et al. (2003). The solid line shows our best-fit model (the “full” model, with parameter values listed in Table 1). The fit assumes h = 0.7 because observationally inferred masses scale as h-2. a) Variations of the stellar mass function for different assumptions on merging and stripping: best-fit full model (black solid line), no tidal stripping (ηstrip = 0, red dotted line), no mergers at all (green dashed line), and maximum merging (blue dash-dotted line); b) variations of the stellar mass function for different assumptions on the baryonic physics: best-fit full model (black solid line, same as in panel a), baryons trace dark matter (mstars = fb Mhalo, red dotted line), no high-mass cutoff (Mshock → ∞, green dashed line), and no low circular velocity cutoff (vSN = vreion = 0, blue dash-dotted line). In both panels, all variations start from the best-fit parameters of the full model except for the fact that we use ηstrip = 0 in all models apart from the full one.
Current usage metrics show cumulative count of Article Views (full-text article views including HTML views, PDF and ePub downloads, according to the available data) and Abstracts Views on Vision4Press platform.
Data correspond to usage on the plateform after 2015. The current usage metrics is available 48-96 hours after online publication and is updated daily on week days.
Initial download of the metrics may take a while.