Fig. 2
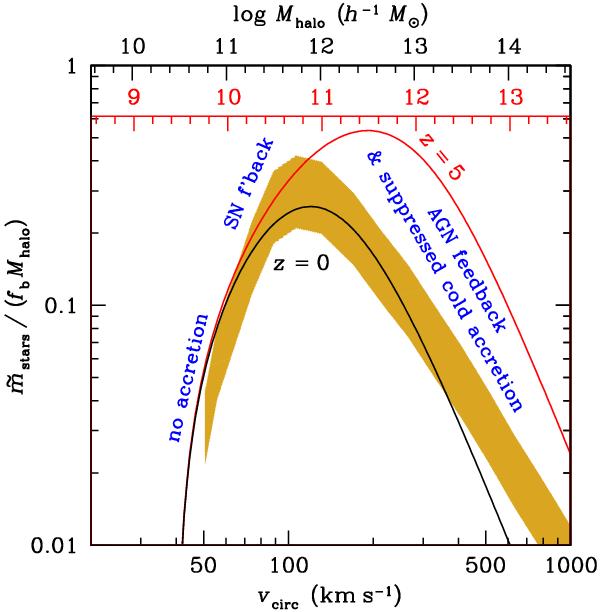
Star formation efficiency versus halo circular velocity and mass at two different epochs in our toy model (Eq. (8)). This figure has been plotted for the parameters of Table 1 that produce the best fit to the stellar mass function at z = 0 (see Sect. 3.1). The upper (black) mass scale is for z = 0, while the lower (red) mass scale is for z = 5. The gold shaded region shows the relation predicted by abundance matching by Guo et al. (2010).
Current usage metrics show cumulative count of Article Views (full-text article views including HTML views, PDF and ePub downloads, according to the available data) and Abstracts Views on Vision4Press platform.
Data correspond to usage on the plateform after 2015. The current usage metrics is available 48-96 hours after online publication and is updated daily on week days.
Initial download of the metrics may take a while.