Fig. 2
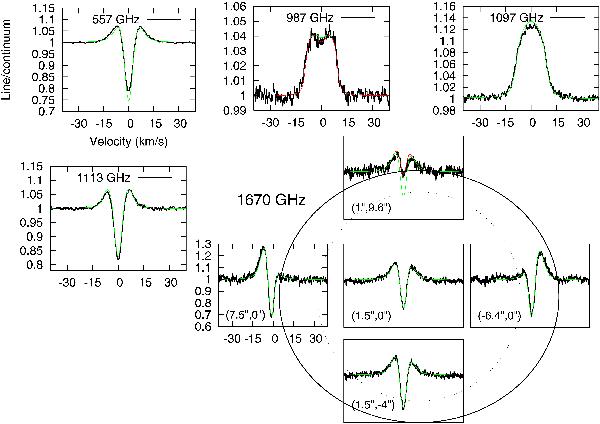
Entire set of Herschel / HIFI H2O observations of June 24, 2010. Saturn’s sub-observer latitude β = +2°. The 557, 987, 1097, and 1113 GHz lines were observed sequentially at an orbital longitude of Enceladus L = 8°−24°, while the 1670 GHz map was acquired at L = 128°−134°. Observations are here modeled with a simplified, “homogeneous”, torus model whose free parameters are the H2O column density (NH2O) and the velocity dispersion of the molecules (Vrms, assumed constant throughout the torus). Green lines are models with Vrms = 2.3 km s-1 and NH2O = 1.5 × 1013 cm-2 (1.75 × 1013 cm-2 for the 1670 GHz east, west and south limbs spectra). The red line at 987 GHz has NH2O = 2.5 × 1013 cm-2. The red line for the 1670 GHz north limb spectrum has NH2O = 0.75 × 1013 cm-2. For the 1670 GHz map, precise pointing (as indicated as RA, Dec offsets from Saturn’s center as inset) was recovered from the examination of the continuum levels and slight line asymmetries. The inner dotted circle compares the 12.6′′ beam at this frequency with Saturn 17.2′′ × 15.4′′ disk (outer solid circle).
Current usage metrics show cumulative count of Article Views (full-text article views including HTML views, PDF and ePub downloads, according to the available data) and Abstracts Views on Vision4Press platform.
Data correspond to usage on the plateform after 2015. The current usage metrics is available 48-96 hours after online publication and is updated daily on week days.
Initial download of the metrics may take a while.