Free Access
Fig. 1
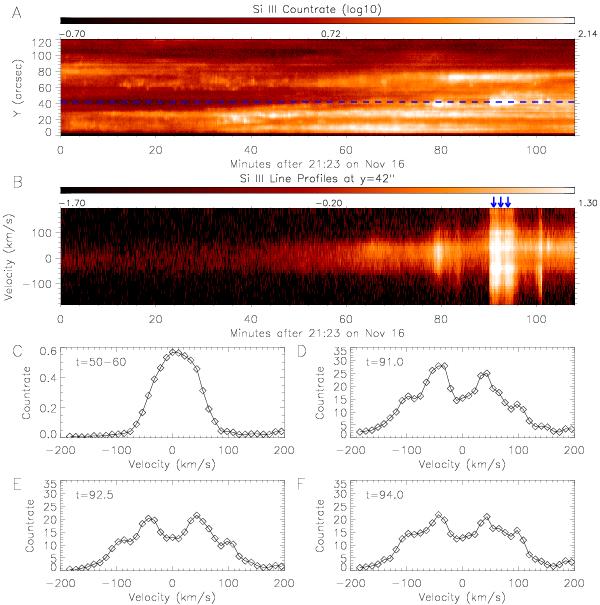
Evolution of profiles of EE1 observed on Nov. 16 around 22:55. The profile of the Si iii line splits into two components; over several minutes upflow and downflow stay unchanged within the 0.3′′ wide slit.
Current usage metrics show cumulative count of Article Views (full-text article views including HTML views, PDF and ePub downloads, according to the available data) and Abstracts Views on Vision4Press platform.
Data correspond to usage on the plateform after 2015. The current usage metrics is available 48-96 hours after online publication and is updated daily on week days.
Initial download of the metrics may take a while.