Fig. 8
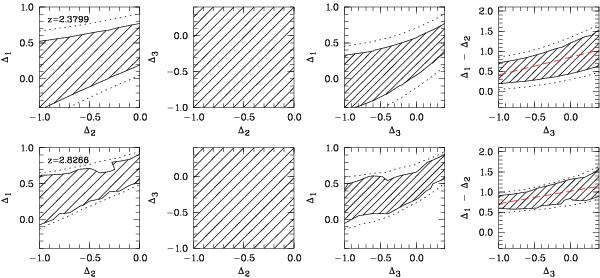
Projected 1σ (marked areas) and 3σ (dotted lines) confidence contours of the SED parameters for the observed systems at z = 2.3799 (upper panels), and z = 2.8266 (lower panels). The projections in each of the three possible planes are shown (Δ1 versus Δ2, Δ3 versus Δ2, and Δ1 versus Δ3; from left to right). The rightmost panels display the confidence regions considering the enhancement of the break at 3 Ryd, i.e. Δ1 − Δ2 versus the strength of the 4 Ryd break Δ3, where the dashed lines indicate a fitted linear correlation (see text). The contours of the z = 2.8266 system are smoothed for a clearer presentation.
Current usage metrics show cumulative count of Article Views (full-text article views including HTML views, PDF and ePub downloads, according to the available data) and Abstracts Views on Vision4Press platform.
Data correspond to usage on the plateform after 2015. The current usage metrics is available 48-96 hours after online publication and is updated daily on week days.
Initial download of the metrics may take a while.