Fig. 5
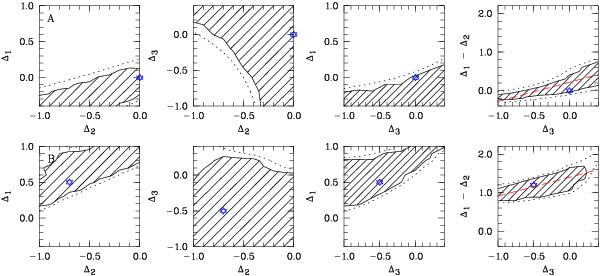
1σ (marked areas) and 3σ (dotted lines) confidence regions of the tested SED parameters for test cases A (upper panels) and B (lower panels). The three left panels show the projections into each of the three possible planes, i.e. Δ1 versus Δ2, Δ3 versus Δ2, and Δ1 versus Δ3, respectively. The right panels show the enhancement of the intensity break at 3 Ryd compared to the HM01 background, which means Δ1 − Δ2, versus the strength of the 4 Ryd break Δ3, where the dashed line indicates a linear fit of the correlation (see text). The parameters of the input SEDs are marked with stars.
Current usage metrics show cumulative count of Article Views (full-text article views including HTML views, PDF and ePub downloads, according to the available data) and Abstracts Views on Vision4Press platform.
Data correspond to usage on the plateform after 2015. The current usage metrics is available 48-96 hours after online publication and is updated daily on week days.
Initial download of the metrics may take a while.