Fig. 4
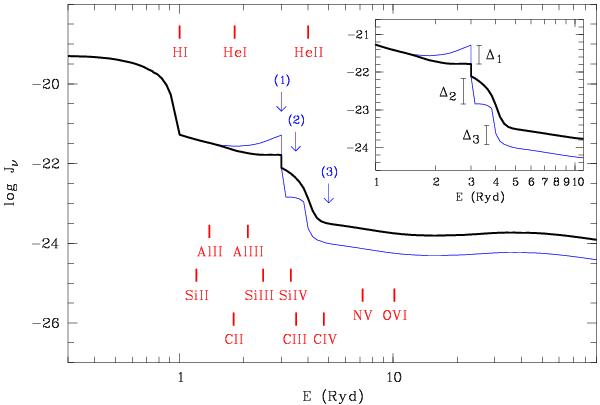
Spectral energy distribution of the ionizing radiation in comparison to the ionization potential of several species. The thick line represents the UV background at z ~ 2.0 according to the model of (Haardt & Madau 2001, HM01), which is adopted as ionizing radiation for test case A (see Sect. 4). The thin line indicates an example of a modified spectrum, where the main characteristics varied in this work are marked with arrows. They are measured in deviation from the HM01 spectrum in dex as indicated in the inset. These are (1) the height of the He ii Lyα re-emission peak at 3 Ryd Δ1; (2) the flux level in the energy range 3 < E < 4 Ryd Δ2; and (3) the depth of the He ii break at 4 Ryd Δ3. The presented modified SED can parameterized with Δ1 = + 0.5, Δ2 = −0.7, and Δ3 = −0.5, and is adopted for test case B in Sect. 4.
Current usage metrics show cumulative count of Article Views (full-text article views including HTML views, PDF and ePub downloads, according to the available data) and Abstracts Views on Vision4Press platform.
Data correspond to usage on the plateform after 2015. The current usage metrics is available 48-96 hours after online publication and is updated daily on week days.
Initial download of the metrics may take a while.