| Issue |
A&A
Volume 532, August 2011
|
|
|---|---|---|
| Article Number | L8 | |
| Number of page(s) | 4 | |
| Section | Letters | |
| DOI | https://doi.org/10.1051/0004-6361/201116978 | |
| Published online | 22 July 2011 | |
Letter to the Editor
The remnant of SN 1987A revealed at (sub-)mm wavelengths⋆
1 European Organization for Astronomical Research in the Southern Hemisphere (ESO), Karl-Schwarzschild-Str. 2, 85748 Garching b. München, Germany
e-mail: mlakicev@eso.org
2 Astrophysics Group, Lennard-Jones Laboratories, Keele University, Staffordshire ST5 5BG, UK
3 International Centre for Radio Astronomy Research, M468, University of Western Australia, Crawley, WA 6009, Australia
Received: 29 March 2011
Accepted: 28 April 2011
Context. Supernova 1987A (SN 1987A) exploded in the Large Magellanic Cloud (LMC). Its proximity and rapid evolution makes it a unique case study of the early phases in the development of a supernova remnant. One particular aspect of interest is the possible formation of dust in SN 1987A, as SNe could contribute significantly to the dust seen at high redshifts.
Aims. We explore the properties of SN 1987A and its circumburst medium as seen at mm and sub-mm wavelengths, bridging the gap between extant radio and infrared (IR) observations of respectively the synchrotron and dust emission.
Methods. SN 1987A was observed with the Australia Telescope Compact Array (ATCA) at 3.2 mm in July 2005, and with the Atacama Pathfinder EXperiment (APEX) at 0.87 mm in May 2007. We present the images and brightness measurements of SN 1987A at these wavelengths for the first time.
Results. SN 1987A is detected as an unresolved point source of 11.2 ± 2.0 mJy at 3.2 mm (5′′ beam) and 21 ± 4 mJy at 0.87 mm (18′′ beam). These flux densities are in perfect agreement with extrapolations of the powerlaw radio spectrum and modified-blackbody dust emission, respectively. This places limits on the presence of free-free emission, which is similar to the expected free-free emission from the ionized ejecta from SN 1987A. Adjacent, fainter emission is observed at 0.87 mm extending ~0.5′ towards the south-west. This could be the impact of the supernova progenitor’s wind when it was still a red supergiant upon a dense medium.
Conclusions. We have established a continuous spectral energy distribution for the emission from SN 1987A and its immediate surroundings, linking the IR and radio data. This places limits on the contribution from ionized plasma. Our sub-mm image reveals complexity in the distribution of cold dust surrounding SN 1987A, but leaves room for freshly synthesized dust in the SN ejecta.
Key words: ISM: supernova remnants / ISM: individual objects: SN 1987A / radio continuum: ISM / submillimeter: ISM / infrared: ISM
© ESO, 2011
1. Introduction
Supernovae (SNe) and their remnants (SNRs) are important sources of matter and momentum to a galactic interstellar medium (ISM) and the main creators of chemical abundances throughout the Universe. The SN explosions of massive stars are also a potentially important source of dust, with estimates ranging from 0.2–4 M⊙ of dust (Dunne 2003) to much lower measured amounts < 0.01 M⊙ (Sandstrom et al. 2009). These kinds of measurements are complicated, because SNRs are frequently witnessed to hit surrounding dust clouds (e.g., N 49 in the LMC – van Loon et al. 2010; Otsuka et al. 2010).
The remnant of SN 1987A in the Large Magellanic Cloud (LMC) is one of the most studied SNRs thanks to its proximity ( ≈ 50 kpc) and early stage of (rapid) evolution. Its progenitor is believed to have been a red supergiant (RSG) in a binary system, prior to becoming the blue supergiant that was witnessed to vanish (Barkat & Wheeler 1988, and references therein). Its circumburst environment has been studied in great detail, revealing a dusty equatorial ring ~2′′ in diameter (Bouchet et al. 2006) with two fainter isomorphological rings – but offset from the former – on either side of SN 1987A. The light echo from SN 1987A has been used to probe the surrounding ISM (Xu et al. 1995). The blast wave from SN 1987A likely reached dense circumburst regions around day 6000 and the resulting increased radiation is observed at all frequencies (Dwek et al. 2010; Zanardo et al. 2010).
While the emission from the immediate vicinity of SN 1987A at radio frequencies is due exclusively to synchrotron radiation arising from magnetized plasma (see Zanardo et al. 2010, for an overview), the mid-infrared (IR) emission is attributed to a few 10-6 M⊙ of warm (~170 K) RSG dust in the equatorial ring (Bouchet et al. 2006). As much as 0.7 M⊙ of cold (~20 K) dust has been detected in Herschel images, and interpreted as having been freshly-synthesized in the ejecta of SN 1987A (Matsuura et al. 2011).
The as yet unexplored sub-mm and mm portion of the electro-magnetic spectrum offers an additional avenue to probe the coldest dust and to possibly reveal additional sources of radiation. We present here the observations of SN 1987A at 0.87 mm and 3.2 mm, constituting the first detections of SN 1987A at wavelengths 0.35 < λ < 8 mm.
2. Measurements
We retrieved unpublished data obtained with the Atacama Pathfinder EXperiment (APEX) from the European Southern Observatory (ESO) archive, and re-analysed data obtained with the Australia Telescope Compact Array (ATCA) that have not previously appeared in the refereed literature. The position of SN 1987A is (RA 5h35m28.0s, Dec −69°16′11′′).
2.1. APEX observations at 0.87 mm
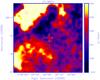 |
Fig. 1 APEX image of SN 1987A at 345 GHz/0.87 mm, obtained in May 2007. The position of SN 1987A is indicated with a cross; the beam is drawn in the upper left corner. |
SN 1987A was observed with the APEX with the Large Apex BOlometer CAmera (LABOCA) at a wavelength of 0.87 mm (345 GHz, with a bandwidth of 60 GHz) on 30 May 2007. The total on-source integration time was 2 h. The field that was imaged in raster-map mode (to fill the spaces between the 295 bolometer array elements) subtends 15′, centred on (RA 5h35m16.8s, Dec − 69°15′00′′), and the beamsize has a full-width at half-maximum (FWHM) of 18′′.
The data were reduced using the Bolometer array Analysis (BoA) software, following standard sub-mm calibration procedures. The individual raster-map scans were first corrected for attenuation by the Earth’s atmosphere, signal calibration factors, and response variations across the bolometer array, and the voltages were then converted to flux densities using the conversion factor determined from measurements of planets during commissioning of the APEX. Then, a series of 20 κ–σ clipping iterations were performed to remove noise spikes that deviate from the mean by more than κ × σ (with κ ≥ 4), taking known bad channels into account. The individual maps were then combined into a single image. The image was smoothed with a Gaussian kernel of σ = 1 pixel, i.e. an FWHM of 14′′, using the Munich Interactive Data Analysis Software (MIDAS), and the resolution of this image is thus 23′′.
The resulting image is shown in Fig. 1. SN 1987A is clearly detected, though it sits at the extremity of a fainter, elongated structure extending ~0.5′ towards the south-west. Part of a molecular cloud complex fills the North-East corner, while a rim of clouds in the south-east may be associated with the large Honeycomb SNR B0536 − 69.3 (Chu et al. 1995). We used the center/moment task to measure the flux density of SN 1987A from a Gaussian fit to be 21 ± 4 mJy. Attempts to measure the flux density using different software suggest an accuracy of ~10%, but the highly structured background leads us to adopt a more conservative value of ~20%. The MIDAS task that we used also returned a value of 16′′ for the FWHM, which is in fair agreement with the angular resolution, lending support to the detection of a point source at the position of SN 1987A.
2.2. ATCA observations at 3 mm
SN 1987A was observed with the ATCA on 11–12 July 2005, with the 3-mm receiver in two frequency bands, one between 93.45–93.56 GHz (peak reception at 93.49 GHz) and another between 95.5–95.6 GHz (peak reception at 95.57 GHz). The observations were carried out with the most compact antenna configuration, H75, with an on-source observing time of ~8 h.
The bands were reduced simultaneously using standard procedures within the miriad software, and ultimately merged. Firstly, the signal was corrected for elevation-dependent attenuation using up-to-date antenna reconfiguration files with the task atfix. The phase stability and antenna tracking were investigated and found to be mostly within 0.2–0.5 mm and (typically) 0.3–0.6′′ to (occasionally) ~3′′. Data obtained during tracking errors of >3′′ were flagged as bad, with the task uvflag. Secondly, the task mfcal was used to calibrate the bandpasses and phase offsets against observations of the primary reference sources 1921−293 (at the start) and 1253−055 (at the end), and the phase variations against regular observations of the secondary reference sources 0637−752 and 0454−810. Absolute flux calibration was achieved using the task mfboot against an observation of the planet Uranus. The flux calibration appeared reliable at a 10–20% level. Thirdly, the signal as function of baseline in the uv plane (visibilities) was inverted using a standard fast-Fourier transform with the task invert, where the visibilities were weighted according to the noise variance (i.e. system temperature) but otherwise uniformly across a 1-arcmin field chosen to effectively suppress the sidelobes. A multi-frequency synthesis approach was taken, producing an image at 94.5 GHz (3.2 mm) with an rms noise level of 2.0 mJy beam-1. This map was cleaned with the tasks clean and restor, employing a Högbom scheme (Högbom 1974). The resulting beam has an FWHM of 5.0′′ × 4.7′′ in RA and Dec.
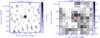 |
Fig. 2 Left: ATCA image of SN 1987A at 94.5 GHz/3.2 mm, obtained in July 2005. The synthesized beam is drawn just next to it. Right: unsmoothed APEX image of SN 1987A at 345 GHz/0.87 mm, shown on the same scale as the 3.2 mm image. The beam is drawn centred on the exact position of SN 1987A; the inset is a schematic of the ring structures seen in HST images. |
The calibrated image is shown in Fig. 2 (left), where SN 1987A is clearly detected as an unresolved source at a level of 11.2 ± 2.0 mJy. The other intensity peaks in the image are much dimmer and unlikely to be real astrophysical sources.
3. Discussion
3.1. Bridging the IR and radio spectral energy distributions
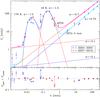 |
Fig. 3 Spectral energy distribution from the IR (Bouchet et al. 2006; Seok et al. 2008; Dwek et al. 2010; Matsuura et al. 2011) to the radio (Manchester et al. 2005; Potter et al. 2009; Zanardo et al. 2010), including our first measurements at sub-mm (APEX) and mm (ATCA) wavelengths. Overplotted are modified blackbodies to represent two dust components, two steep radio powerlaws to represent synchrotron radiation, and two shallow powerlaws to represent free-free radiation. Cyan and magenta curves represent the sum of all emission for the 2004–5 and 2007–10 period, respectively, with residuals plotted underneath. |
The APEX 0.87 mm and ATCA 3.2 mm detections bridge a gap of a factor > 20 in wavelength. They conjoin the far-IR emission detected up to λ = 350 μm (Matsuura et al. 2011) attributed to thermal radiation from dust grains, on the one hand, and the radio emission detected down to λ = 0.8 cm (Potter et al. 2009) attributed to synchrotron radiation from free charge in a magnetic field, on the other. The full spectral energy distribution (SED) is plotted in Fig. 3, where the IR data comprise groundbased near- and mid-IR, and Spitzer observations published by Bouchet et al. (2006), AKARI observations published by Seok et al. (2008), a Spitzer 70-μm upper limit published by Dwek et al. (2010) and Herschel observations published by Matsuura et al. (2011)1. The radio data solely comprise ATCA observations, published by Manchester et al. (2005), Potter et al. (2009), and by the most up-to-date summary at the longest wavelengths by Zanardo et al. (2010). In Fig. 3 we group these measurements into either of two sets, as close as possible in time to the APEX or ATCA 3.2-mm observations, respectively. This is because both the IR (Dwek et al. 2010) and radio (Zanardo et al. 2010) brightness has been observed to be steadily increasing in recent years. The Herschel measurements were only taken in 2010, three years after the APEX measurements.
Concentrating on the (sub)-mm region of interest, the far-IR-sub-mm emission is represented very well by a modified Planck curve of thermal dust emission:  (1)for a dust temperature T = 18 K and coefficient αIR = −1.5. The mid-IR emission can also be matched with thermal dust emission by employing an identical αIR but different T = 170 K and a total emitting grain surface of 10-5 that of the cold component. While more detailed models for the mid- and far-IR emission have been presented elsewhere (Bouchet et al. 2006; Dwek et al. 2010; Matsuura et al. 2011), this parameterization is consistent with those results and enables a simple decomposition of the overall SED.
The mm-dm radio emission is very well matched with a powerlaw with a coefficient typical of synchrotron radiation:  (2)A value for αradio ≈ 0.75 during 2004–2005 produces an excellent fit to the 3–21 cm data, as well as our new measurement at 3.2 mm, a decade higher in frequency. This renders the measurements by Manchester et al. (2005) somewhat “too” faint. Likewise, for the period 2007–2010 a value for αradio ≈ 0.7 fits the 3–21 cm data well, but again the higher frequency datum published by Potter et al. (2009) lies below an extrapolation of this powerlaw component. Given the difficulty in radio interferometry of conserving flux at the longest baselines, we are tempted to believe the 3.2-mm datum is consistent with a pure synchrotron component. In particular, we do not feel the need to invoke either mm emission from dust (cf. Bot et al. 2010) or free-free emission from a hot plasma.
With regard to the latter, we can set meaningful limits on the contribution from free-free emission:  (3)where αff ≈ 0.1, unless it becomes optically thick – but this typically happens at wavelengths ≫ cm or it reaches the high-energy limit – but that is not the case at IR-radio wavelengths. In fact, Fig. 3 demonstrates that the free-free contribution is limited by the near-IR data (that may include contributions from hot dust and/or atomic line emission), though in recent years it may have become more pronounced and have reached levels that become significant precisely at mm wavelengths. The excellent description of the SED by the cold-dust and synchrotron components leaves room for only a fraction of the measured flux density at 0.87 mm to arise from any additional component; in the most extreme case, ~2 mJy at 1 mm is caused by free-free emission. Since the 0.87 mm datum is positioned on the well-constrained tail of the modified Planck curve, there is little room for variations in its slope to affect the estimation of the limit on free-free emission, Matsuura et al. (2011) consider temperatures up to 23 K but in combination with different αIR.
To gain a notion of the physical implications of this limit on the free-free component, we present an example calculation here. Radiation transfer through a plasma can be written as  (4)where the optical depth is
  (5)where the continuum emission measure
  with the density n measured in cm-3 and the pathlength s measured in pc. The solution to the radiation transfer equation is
 ![\begin{equation} T_{{\rm b},\nu}=\int_0^{\tau_\nu}T\,{\rm e}^{-\tau_\nu}\,{\rm d}\nu =T\left[1-{\rm e}^{\tau_\nu}\right] \end{equation}](/articles/aa/full_html/2011/08/aa16978-11/aa16978-11-eq54.png) (6)in the isothermal case (constant T), where the brightness temperature is defined as Tb,ν = c2Iν/(2ν2k). At high frequencies, limτν → 0Tb,ν = Tτν. Considering 1 M⊙ of ionized ejecta within a region of dimensions ~0.1 pc, i.e. a density n + ~ ne ~ 104 cm-3, and a temperature T ~ 104 − 6 K, one obtains an estimated Tb,300 GHz ~ 0.1 K. With the ejecta subtending ~0.1′′ on the sky, this corresponds to F300 GHz ~ 1 mJy. This has a very similar magnitude to the limit we set on the free-free component. The shock-ionized plasma mass associated with the equatorial ring is estimated to be only ~0.06 M⊙ at densities of 103 − 4 cm-3 (Mattila et al. 2010), and its free-free emission is thus expected to be two orders of magnitude fainter than in the above scenario.
(6)in the isothermal case (constant T), where the brightness temperature is defined as Tb,ν = c2Iν/(2ν2k). At high frequencies, limτν → 0Tb,ν = Tτν. Considering 1 M⊙ of ionized ejecta within a region of dimensions ~0.1 pc, i.e. a density n + ~ ne ~ 104 cm-3, and a temperature T ~ 104 − 6 K, one obtains an estimated Tb,300 GHz ~ 0.1 K. With the ejecta subtending ~0.1′′ on the sky, this corresponds to F300 GHz ~ 1 mJy. This has a very similar magnitude to the limit we set on the free-free component. The shock-ionized plasma mass associated with the equatorial ring is estimated to be only ~0.06 M⊙ at densities of 103 − 4 cm-3 (Mattila et al. 2010), and its free-free emission is thus expected to be two orders of magnitude fainter than in the above scenario.
3.2. The location and origin of cold dust around SN 1987A
The APEX images at 870 μm and Herschel images at 250 μm have an identical resolution, i.e. superior to that of the Herschel images at 350 and 500 μm (beamsizes of 25′′ and 36′′, respectively). While we clearly confirm that most of the detected cold dust (T ≈ 18 K) appears to be concentrated within a region ≪ 23′′ (5 pc) across, our APEX image reveals diffuse emission to the south–west of SN 1987A, which is not visible on the Herschel images, but which coincides with an emission filament seen in HST images (cf. Fig. 2 in Matsuura et al. 2011). We dub this the “S–W plateau”. We also note that in the unsmoothed APEX image (Fig. 2, right), the brightest pixels are slightly offset to the north-east from the exact position of SN 1987A2. These observations leave open the possibility that the 18-K emission arises from part of a larger dust complex, in radiation equilibrium with the ambient interstellar radiation field.
A shell of 4.5 pc radius surrounding SN 1987A was postulated by Chevalier & Emmering (1989) to explain a light echo signal. They suggest that it marks the place where the wind of the red supergiant progenitor is decelerated by the pressure in the surrounding medium. Crotts et al. (2000) detected [N ii] emission from a region that would mark the overlap between this shell and the S–W plateau. They also detected emission from a region at the opposite side of SN 1987A, and Doppler shifts of the line emission suggested the shell expands at a rate of 10–15 km s-1, commensurate with the wind of a metal-poor red supergiant (cf. Marshall et al. 2004). We may have detected emission from the same structures as seen in [N ii], with the APEX at 0.87 mm. That no such structures are seen in the more sensitive ATCA image at 3.2 mm suggests that it is more likely to be dust emission (α < 0) than free-free emission (α > 0).
That said, the flux density associated with the point source at the position of SN 1987A is consistent with the 18-K dust component conjectured by Matsuura et al. (2011) to be due to freshly-synthesized dust in the ejecta from SN 1987A. To show this we employed a modified blackbody of spectral index αIR = −1.5, which is typical of interstellar dust and therefore does not require “exotic” types of grains or “anomalous” emission mechanisms.
4. Conclusions
The first sub-mm (APEX at 0.87 mm) and mm (ATCA at 3.2 mm) observations of SN 1987A that we presented here give a first valuable insight into the dust distribution that surrounds the more compact remnant area. These data bridge the gap in the SED between the previously detected far-IR emission from dust grains (at λ ≤ 0.35 mm) and radio emission from synchrotron radiation (at λ ≥ 0.8 mm). They do not deviate from extrapolation of the far-IR and radio SEDs, respectively, and we set a limit on the contribution from free-free emission from a plasma, which is close to the estimated contribution from the ionized ejecta from SN 1987A. Scheduled high-resolution 3.2-mm observations with the ATCA will improve these constraints.
While the 3.2-mm image (5′′ resolution) is point-like the 0.87-mm image (18′′ resolution) also reveals emission from cold dust towards the southwest, which may be an interaction region for the RSG progenitor’s wind and a dense medium. The (sub)-mm observations presented here provide a valuable guide for preparing high-resolution observations with the Atacama Large Millimeter Array (ALMA), which may settle the question as to the origin of the cold dust that is detected at far-IR (Matsuura et al. 2011) and sub-mm (this work) wavelengths.
Acknowledgments
We are grateful to Dr. Thomas Stanke for advice on the reduction of the archival APEX data. M.L. acknowledges studentships from ESO and Keele University. We thank the referee, John Dickel, for the positive report.
References
- Barkat, Z., & Wheeler, J. C. 1988, ApJ, 332, 247 [NASA ADS] [CrossRef] [Google Scholar]
- Bot, C., Ysard, N., Paradis, D., et al. 2010, A&A, 523, A20 [NASA ADS] [CrossRef] [EDP Sciences] [Google Scholar]
- Bouchet, P., Dwek, E., Danziger, J., et al. 2006, ApJ, 650, 212 [NASA ADS] [CrossRef] [Google Scholar]
- Chevalier, R. A., & Emmering, R. T. 1989, ApJ, 342, L75 [NASA ADS] [CrossRef] [Google Scholar]
- Chu, Y.-H., Dickel, J. R., Staveley-Smith, L., Osterberg, J., & Smith, C. R. 1995, AJ, 109, 1729 [NASA ADS] [CrossRef] [Google Scholar]
- Crotts, A. P. S., & Heathcote, S. R. 2000, ApJ, 528, 426 [NASA ADS] [CrossRef] [Google Scholar]
- Dunne, L., Eales, S., Ivison, R., Morgan, H., & Edmunds, M. 2003, Nature, 285, 424 [Google Scholar]
- Dwek, E., Arendt, R. G., Bouchet, P., et al. 2010, ApJ, 722, 425 [NASA ADS] [CrossRef] [Google Scholar]
- Högbom, J. A. 1974, A&AS, 15, 417 [Google Scholar]
- Manchester, R. N., Gaensler, B. M., Staveley-Smith, L., Kesteven, M. J., & Tzioumis, A. K. 2005, ApJ, 628, L131 [NASA ADS] [CrossRef] [Google Scholar]
- Marshall, J. R., van Loon, J. Th., Matsuura, M., et al. 2004, MNRAS, 355, 1348 [NASA ADS] [CrossRef] [Google Scholar]
- Matsuura, M., Dwek, E., Meixner, M., et al. 2011, Science [arXiv:1107.1477] [Google Scholar]
- Mattila, S., Lundqvist, P., Gröningsson, P., et al. 2010, ApJ, 717, 1140 [NASA ADS] [CrossRef] [Google Scholar]
- Otsuka, M., van Loon, J. Th., Long, K. S., et al. 2010, A&A, 518, L139 [NASA ADS] [CrossRef] [EDP Sciences] [Google Scholar]
- Potter, T. M., Staveley-Smith, L., Ng, C.-Y., et al. 2009, ApJ, 705, 261 [NASA ADS] [CrossRef] [Google Scholar]
- Sandstrom, K. M., Bolatto, A. D., Stanimirović, S., van Loon, J. Th., & Smith, J. D. T. 2009, ApJ, 696, 2138 [NASA ADS] [CrossRef] [Google Scholar]
- Seok, J. Y., Koo, B.-C., Onaka, T., et al. 2008, PASJ, 60, S453 [NASA ADS] [CrossRef] [Google Scholar]
- van Loon, J. Th., Oliveira, J. M., Gordon, K. D., et al. 2010, AJ, 139, 68 [NASA ADS] [CrossRef] [Google Scholar]
- Xu, J., Crotts, A. P. S., & Kunkel, W. E. 1995, ApJ, 451, 806 [NASA ADS] [CrossRef] [Google Scholar]
- Zanardo, G., Staveley-Smith, L., Ball, L., et al. 2010, ApJ, 710, 1515 [NASA ADS] [CrossRef] [Google Scholar]
All Figures
|
Fig. 1 APEX image of SN 1987A at 345 GHz/0.87 mm, obtained in May 2007. The position of SN 1987A is indicated with a cross; the beam is drawn in the upper left corner. |
| In the text | |
|
Fig. 2 Left: ATCA image of SN 1987A at 94.5 GHz/3.2 mm, obtained in July 2005. The synthesized beam is drawn just next to it. Right: unsmoothed APEX image of SN 1987A at 345 GHz/0.87 mm, shown on the same scale as the 3.2 mm image. The beam is drawn centred on the exact position of SN 1987A; the inset is a schematic of the ring structures seen in HST images. |
| In the text | |
|
Fig. 3 Spectral energy distribution from the IR (Bouchet et al. 2006; Seok et al. 2008; Dwek et al. 2010; Matsuura et al. 2011) to the radio (Manchester et al. 2005; Potter et al. 2009; Zanardo et al. 2010), including our first measurements at sub-mm (APEX) and mm (ATCA) wavelengths. Overplotted are modified blackbodies to represent two dust components, two steep radio powerlaws to represent synchrotron radiation, and two shallow powerlaws to represent free-free radiation. Cyan and magenta curves represent the sum of all emission for the 2004–5 and 2007–10 period, respectively, with residuals plotted underneath. |
| In the text | |
Current usage metrics show cumulative count of Article Views (full-text article views including HTML views, PDF and ePub downloads, according to the available data) and Abstracts Views on Vision4Press platform.
Data correspond to usage on the plateform after 2015. The current usage metrics is available 48-96 hours after online publication and is updated daily on week days.
Initial download of the metrics may take a while.