Fig. 3
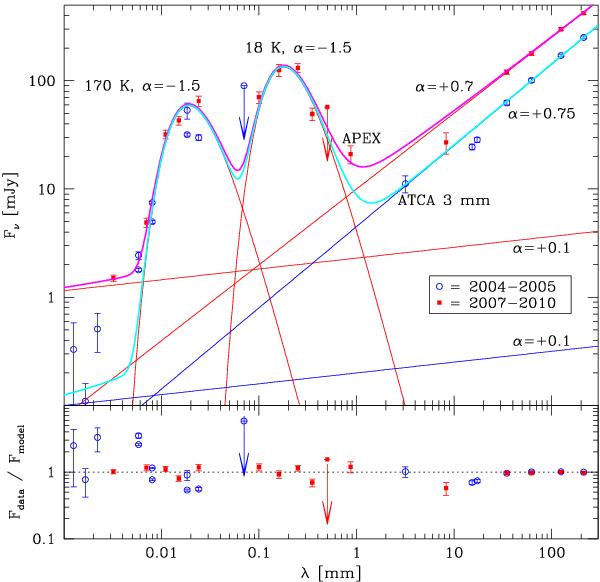
Spectral energy distribution from the IR (Bouchet et al. 2006; Seok et al. 2008; Dwek et al. 2010; Matsuura et al. 2011) to the radio (Manchester et al. 2005; Potter et al. 2009; Zanardo et al. 2010), including our first measurements at sub-mm (APEX) and mm (ATCA) wavelengths. Overplotted are modified blackbodies to represent two dust components, two steep radio powerlaws to represent synchrotron radiation, and two shallow powerlaws to represent free-free radiation. Cyan and magenta curves represent the sum of all emission for the 2004–5 and 2007–10 period, respectively, with residuals plotted underneath.
Current usage metrics show cumulative count of Article Views (full-text article views including HTML views, PDF and ePub downloads, according to the available data) and Abstracts Views on Vision4Press platform.
Data correspond to usage on the plateform after 2015. The current usage metrics is available 48-96 hours after online publication and is updated daily on week days.
Initial download of the metrics may take a while.