Fig. A.2
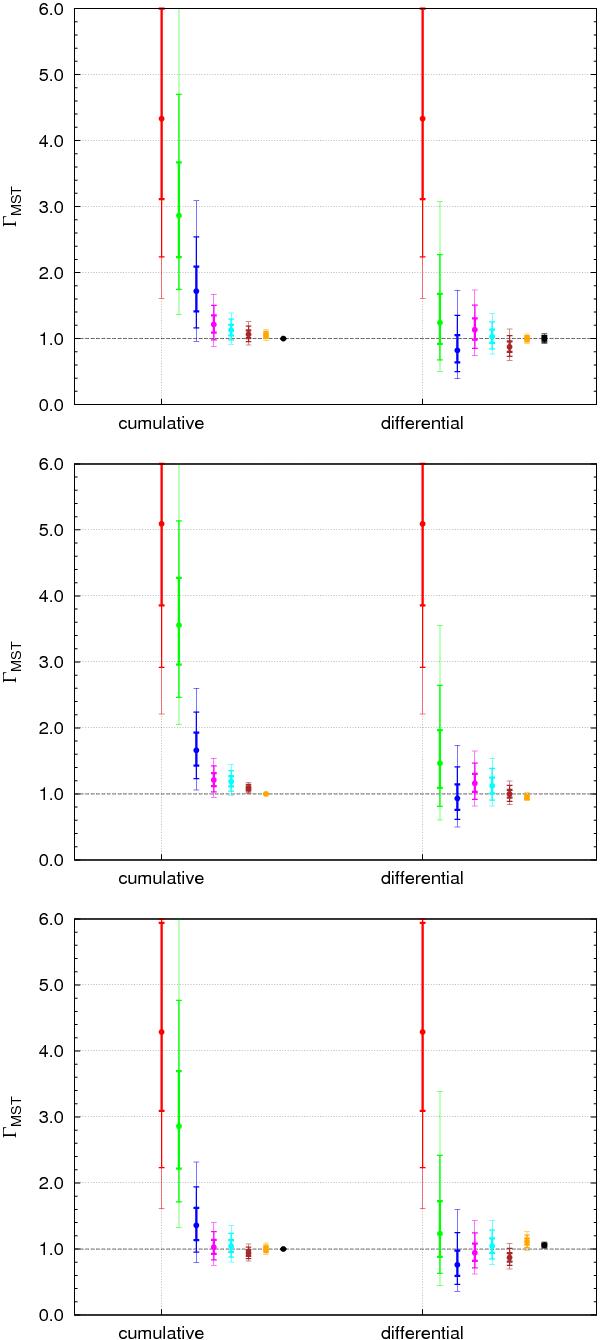
Diagnostics of mass segregation for three sets of observational data of the young Orion nebula cluster (ONC). The left-hand side shows from left to right ΓMST of the 5, 10, 20, 50, 100, 200, 500 most massive, and all stars, i.e. cumulative mass groups; the right-hand side shows from left to right ΓMST of the 5, 6 to 10, 11 to 20, 21 to 50, 51 to 100, 101 to 200, 201 to 500, and 500 to all most massive stars, i.e. differential mass groups. The error bars and line thickness mark the 1σ, 2σ, and 3σ uncertainties. Top: original set of 929 stars observed by Hillenbrand (1997). Middle: incomplete sample. Bottom: reconstructed sample.
Current usage metrics show cumulative count of Article Views (full-text article views including HTML views, PDF and ePub downloads, according to the available data) and Abstracts Views on Vision4Press platform.
Data correspond to usage on the plateform after 2015. The current usage metrics is available 48-96 hours after online publication and is updated daily on week days.
Initial download of the metrics may take a while.