Fig. 7
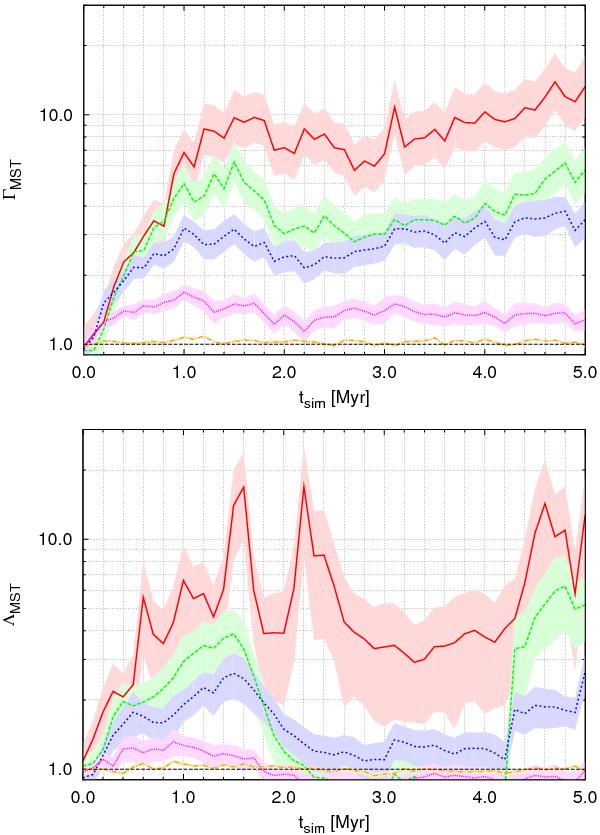
Dynamical mass segregation in a star cluster with 1 k particles and cold initial conditions (Q = 0.1). The plots show the mean ΓMST (top) and ΛMST (bottom) of three simulations for the 5 (red solid line), 10 (green long-dashed line), 20 (blue short-dashed line), 50 (magenta dotted line), and 500 (orange dot-dashed line) most massive stars over time. The filled regions indicate 1σ uncertainties.
Current usage metrics show cumulative count of Article Views (full-text article views including HTML views, PDF and ePub downloads, according to the available data) and Abstracts Views on Vision4Press platform.
Data correspond to usage on the plateform after 2015. The current usage metrics is available 48-96 hours after online publication and is updated daily on week days.
Initial download of the metrics may take a while.