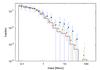
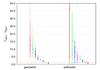
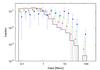
Fig. 4
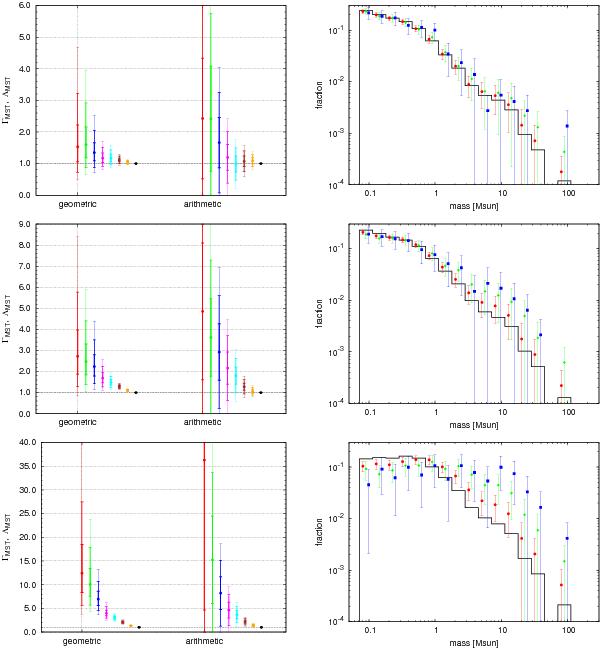
Diagnostics of initially mass segregated star clusters with 1 k members following the prescription of Šubr et al. (2008). From top to bottom the degree of mass segregation, S, equals 0.1, 0.3, and 0.9 (see text for more details). On the left-hand side we compare ΓMST and ΛMST for the 5, 10, 20, 50, 100, 200, 500, 1000 most massive stars. The error bars and line thickness mark the 1σ, 2σ, and 3σ uncertainties. On the right-hand side we plot the corresponding mass function of the entire cluster population (solid black line), and the population within one (red tics), one-half (green crosses), and one-forth (blue dots) half-mass radius. The error bars mark the 1σ uncertainties.
Current usage metrics show cumulative count of Article Views (full-text article views including HTML views, PDF and ePub downloads, according to the available data) and Abstracts Views on Vision4Press platform.
Data correspond to usage on the plateform after 2015. The current usage metrics is available 48-96 hours after online publication and is updated daily on week days.
Initial download of the metrics may take a while.