| Issue |
A&A
Volume 532, August 2011
|
|
|---|---|---|
| Article Number | A103 | |
| Number of page(s) | 11 | |
| Section | Galactic structure, stellar clusters and populations | |
| DOI | https://doi.org/10.1051/0004-6361/201116883 | |
| Published online | 02 August 2011 | |
The mass function of IC 4665 revisited by the UKIDSS Galactic Clusters Survey⋆,⋆⋆,⋆⋆⋆
1
Instituto de Astrofísica de Canarias, C/ Vía Láctea s/n, 38200 La Laguna, Tenerife, Spain
e-mail: This email address is being protected from spambots. You need JavaScript enabled to view it.
2
Departamento de Astrofísica, Universidad de La Laguna (ULL), 38205 La Laguna, Tenerife, Spain
3
European Southern Observatory, Alonso de Cordoba 3107, Casilla 19001 Santiago 19, Chile
e-mail: This email address is being protected from spambots. You need JavaScript enabled to view it.
, This email address is being protected from spambots. You need JavaScript enabled to view it.
4
UJF-Grenoble 1/CNRS-INSU, Institut de Planétologie et d’Astrophysique de Grenoble (IPAG) UMR 5274, 38041 Grenoble, France
e-mail: This email address is being protected from spambots. You need JavaScript enabled to view it.
, ,This email address is being protected from spambots. You need JavaScript enabled to view it.
5
Scottish Universities’ Physics Alliance (SUPA), Institute for Astronomy, School of Physics & Astronomy, University of Edinburgh, Royal Observatory, Blackford Hill, Edinburgh EH9 3HJ, UK
e-mail: This email address is being protected from spambots. You need JavaScript enabled to view it.
Received: 14 March 2011
Accepted: 9 June 2011
Abstract
Context. Knowledge of the mass function in open clusters constitutes one way to constrain the formation of low-mass stars and brown dwarfs as does the knowledge of the frequency of multiple systems and the properties of disks.
Aims. The aim of the project is to determine the shape of the mass function in the low-mass and substellar regimes in the pre-main sequence (27 Myr) cluster IC 4665, which is located at 350 pc from the Sun.
Methods. We have cross-matched the near-infrared photometric data from the Eighth Data Release (DR8) of the UKIRT Infrared Deep Sky Survey (UKIDSS) Galactic Clusters Survey (GCS) with previous optical data obtained with the Canada-France-Hawaii (CFH) wide-field camera to improve the determination of the luminosity and mass functions in the low-mass and substellar regimes.
Results. The availability of i and z photometry taken with the CFH12K camera on the Canada France Hawaii Telescope added strong constraints to the UKIDSS photometric selection in this cluster, which is located in a dense region of our Galaxy. We have derived the luminosity and mass functions of the cluster down to J = 18.5 mag, corresponding to masses of ~0.025 M⊙ at the distance and age of IC 4665 according to theoretical models. In addition, we have extracted new candidate members down to ~20 Jupiter masses in a previously unstudied region of the cluster.
Conclusions. We have derived the mass function over the 0.6−0.04 M⊙ mass range and found that it is best represented by a log-normal function with a peak at 0.25−0.16 M⊙, consistent with the determination in the Pleiades.
Key words: techniques: photometric / stars: low-mass / brown dwarfs / stars: luminosity function, mass function / infrared: stars / open clusters and associations: individual: IC 4665
This work is based in part on data obtained as part of the UKIRT Infrared Deep Sky Survey. The United Kingdom Infrared Telescope is operated by the Joint Astronomy Centre on behalf of the Science and Technology Facilities Council of the UK.
This work is partly based on observations obtained at the Canada-France-Hawaii Telescope (CFHT), which is operated by the National Research Council of Canada, the Institut National des Sciences de l’Univers of the Centre National de la Recherche Scientifique of France, and the University of Hawaii.
Full Tables A.1, B.1, and C.1 are only available at the CDS via anonymous ftp to cdsarc.u-strasbg.fr (130.79.128.5) or via http://cdsarc.u-strasbg.fr/viz-bin/qcat?J/A+A/532/A103
© ESO, 2011
1. Introduction
The initial mass function (IMF), the number of stars formed in the galactic disk and in clusters, was first defined by Salpeter (1955). Later, Miller & Scalo (1979) and Scalo (1986) conducted a more accurate study of the IMF. It represents an important link between stellar and galactic evolution and is one of the key tools for our understanding of the theories of star formation in the high-mass, low-mass, and substellar regimes. The current knowledge drawn from the latest sets of data available in the solar neighbourhood and in clusters points towards a power-law or log-normal representation of the IMF (Kroupa 2002; Chabrier 2003; Larson 2005).
Over the past decade, deep optical surveys conducted in 50 − 600 Myr old open clusters have uncovered numerous young pre-main-sequence stars and brown dwarfs. New stellar and substellar members have been identified in clusters, including the Pleiades (Bouvier et al. 1998; Zapatero Osorio et al. 1999; Dobbie et al. 2002b; Moraux et al. 2003; Bihain et al. 2006; Lodieu et al. 2007a), α Per (Stauffer et al. 1999; Barrado y Navascués et al. 2002; Lodieu et al. 2005), IC 2391 (Barrado y Navascués et al. 2001b, 2004; Spezzi et al. 2009), M 35 (Barrado y Navascués et al. 2001a), Blanco 1 (Moraux et al. 2007), IC 4665 (de Wit et al. 2006; Cargile & James 2010), the Hyades (Dobbie et al. 2002a; Bouvier et al. 2008), and NGC 2547 (Naylor et al. 2002; Jeffries et al. 2004; Jeffries & Oliveira 2005). Cluster membership in these works is generally assessed by proper motion (Hambly et al. 1999; Adams et al. 2001; Moraux et al. 2001; Deacon & Hambly 2004; Lodieu et al. 2007a), near-infrared photometry (Zapatero Osorio et al. 1997; Barrado y Navascués et al. 2002; Lodieu et al. 2007a), and optical spectroscopy for spectral typing, chromospheric activity, and surface gravity (Steele & Jameson 1995; Martín et al. 1996; Lodieu et al. 2005; Bihain et al. 2010). The I − J and I − K optical-to-infrared colours have proven their efficiency to weed out background giants and field dwarfs as emphasised by optical-infrared surveys carried out in the Pleiades (Zapatero Osorio et al. 1997), α Per (Barrado y Navascués et al. 2002; Lodieu et al. 2005), and σ Orionis (Béjar et al. 2001; Caballero et al. 2007).
The Two Micron All-sky Survey (2MASS; Cutri et al. 2003) and Deep Near-Infrared Survey (DENIS; Epchtein et al. 1997) provide JHK photometry for all sources down to Ks ~ 14.5 mag, enabling us to confirm the membership of selected low-mass cluster candidates in numerous regions. However, those panoramic surveys are too shallow to probe substellar candidates, except in the nearest and youngest clusters and star-forming regions (Tej et al. 2002).
The UKIRT Deep Infrared Sky Survey (UKIDSS; Lawrence et al. 2007)1, made of five sub-surveys, is designed to reach three to four magnitudes deeper than 2MASS and cover several thousand of square degrees at infrared wavelengths. The UKIDSS project is defined in Lawrence et al. (2007) and uses the Wide Field Camera (WFCAM; Casali et al. 2007) installed on the UK InfraRed Telescope (UKIRT) and the Mauna Kea Observatory (MKO; Tokunaga et al. 2002) photometric system described in Hewett et al. (2006). The pipeline processing is described in Irwin et al. (in prep.)2 and the WFCAM Science Archive (WSA) in Hambly et al. (2008).
The Galactic Clusters Survey (GCS), one of the UKIDSS sub-surveys, aims at probing young brown dwarfs in ten star-forming regions and open clusters over large areas in five passbands (ZYJHK) across the 1.0 − 2.5 micron wavelength range with a second epoch in K. The main goal is to measure the form of the IMF (Salpeter 1955; Miller & Scalo 1979; Scalo 1986) in the substellar regime to tackle important issues including the formation and spatial distribution of low-mass stars and brown dwarfs. Early results for Upper Scorpius, in the Pleiades, σ Orionis, and in Praesepe are presented in Lodieu et al. (2006, 2007b, 2008, 2011), Lodieu et al. (2007a), Lodieu et al. (2009), and Baker et al. (2010), respectively.
Among the open clusters targeted by the GCS is IC 4665, whose central coordinates are RA = 17h40 and dec = 05°. This cluster is of special interest because it is among the few pre-main-sequence open clusters with an age between 10 and 50 Myr. It has suffered little dynamical evolution and the measured mass function is close to the real IMF because star-formation processes have ended. The cluster is young with a lithium age of 27 Myr (Manzi et al. 2008), consistent with the nuclear age estimate (36 Myr; Mermilliod 1981), activity probes (<40 Myr; Montes & Martin 1998), and other independent studies (30 − 40 Myr; Lynga 1995; Dambis 1999; Kharchenko et al. 2005a). Several distance estimates are available for IC 4665. Abt & Chaffee (1967) found 324 pc from isochrone fitting, Lynga (1995) reported 430 pc in his catalogue of open clusters and Mermilliod (1981) derived ~350 pc. Independent studies based on Hipparcos observations derived a mean distance close to 350 pc: Dambis (1999) obtained 370 ± 100 pc, Hoogerwerf et al. (2001) reported 385 ± 40 pc, and Kharchenko et al. (2005a) inferred 352 pc. In this paper, we will adopt an age of 30 Myr and a distance of 350 pc. Previous studies of the cluster provided a list of low-mass members based on their spectral types, radial velocities, and lithium abundances (for a summary, see Prosser 1993). A recent deep optical (I,z) survey covering the central 3.82 square degrees in the cluster identified new candidate members down to 0.03 M⊙ (de Wit et al. 2006). Near-infrared photometry was extracted from 2MASS with additional photometry obtained for a subsample of brown dwarf candidates with the infrared camera on the Canada-France-Hawaii (CFH) telescope.
We present ZYJHK photometry for a ~4.3 square degree area centred on IC 4665 obtained with the WFCAM wide-field imager on UKIRT within the framework of the UKIDSS Galactic Clusters Survey to investigate the low-mass and substellar mass function. This paper is organised as follows. In Sect. 2 we describe the optical observations obtained with the CFHT in 2002. In Sect. 3 we present the GCS survey. In Sect. 4 we describe the selection of candidates, revise the membership of the optically selected candidates on the basis of their new infrared colours, and explain the identification of new cluster member candidates in the GCS. In Sect. 5 we derive the luminosity and mass function for IC 4665 in the low-mass and substellar regimes.
2. The optical survey
The optical survey was described in detail in de Wit et al. (2006). We provide here a brief summary to bring our infrared observations (Sect. 3) into context. The open cluster IC 4665 was targeted within the framework of a deep, wide-field, photometric survey of open clusters and star-forming regions aimed at studying the influence of the environment on the mass function. The observations, conducted in June 2002, surveyed 3.82 square degrees in the cluster down to a completeness limit of I,z = 22 mag, corresponding to ~0.03 M⊙, assuming a distance of 350 pc and an age of 50 − 100 Myr (Prosser 1993). We adopt the following notation throughout the paper: Z (in capital letter) refers to the WFCAM Z filter with a narrow bandpass (centred at 0.8 μm) and z refers to the CFH12K optical z filter. The selection of cluster member candidates in the (I − z,I) colour − magnitude diagram yielded a total of 691 low-mass and 94 brown dwarf candidates, assuming the age and distance indicated above. The 2MASS catalogue was queried to provide infrared photometry for candidates brighter than Ks = 14.3 mag. Additional infrared (JHK) photometry was obtained for a subset of 101 candidates with the CFHT infrared camera (CFHTIR). The number of candidates selected from the optical colour − magnitude diagram alone and later rejected on the basis of their I − K colours is about 35% at faint magnitudes, showing the efficiency of the near-infrared photometry. The contamination by field stars was also estimated from two control fields. The derived mass function after correction for statistical contamination was best fit by a lognormal with a mean mass of 0.32 M⊙, comparable to results in the Pleiades (Martín et al. 1998; Dobbie et al. 2002b; Tej et al. 2002; Moraux et al. 2003; Lodieu et al. 2007a), and α Per (Barrado y Navascués et al. 2002).
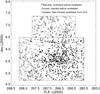 |
Fig. 1 Schematic view of the UKIDSS GCS coverage in IC 4665 is shown with thick solid lines. We included known high probability photometric candidates (star symbols) from Prosser (1993), the optical (I,z) candidates de Wit et al. (2006) confirmed (filled circles) and rejected (plus symbols) by the GCS photometry, as well as new photometric candidates identified in the GCS outside the optical coverage (open triangles). A more detailed view of the optical coverage is shown in Fig. 2 of de Wit et al. (2006). |
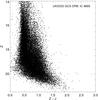 |
Fig. 2 (Z − J, Z) colour–magnitude diagram for 4.3 square degrees surveyed in IC 4665 by the UKIDSS GCS. One out of 10 sources is plotted. |
3. The UKIDSS GCS infrared survey
We extracted all point sources from the UKIDSS GCS DR8 (September 2010) that are located within a three degree radius around the centre of IC 4665 using a similar Structure Query Language (SQL) query to our work in the Pleiades (Lodieu et al. 2007a). In summary, we selected only point sources detected in ZYJHK, as well as point sources with JHK photometry, but undetected in Z and Y. The final catalogue contains 303 978 sources distributed in the sky as illustrated in Fig. 1. The corresponding (Z − J, Z) colour − magnitude diagram is presented in Fig. 2 for one out of ten point source. All sources fainter than Z = 11.5, J = 11.0, and K = 9.9 mag were retrieved but our analysis will solely focus on candidates fainter than J ~ 13.3 mag. This limit is set by the original selection in the (I − z,z) colour − magnitude diagram (Fig. 7 in de Wit et al. 2006) where only objects fainter than I = 15 mag were considered, corresponding to a mass of ~0.6 M⊙ according to 30 Myr isochrones (Baraffe et al. 1998; Chabrier et al. 2000) shifted to a d = 350 pc. The GCS survey of IC 4665 is complete down to J ~ 18.8 mag and K ~ 18.1 mag, respectively, adopting a power law fit to the histograms of the numbers of point sources as a function of magnitude. We are able to detect objects a magnitude fainter, which we adopt as our detection limits.
The central coordinates of the tiles observed by the GCS in IC 4665 are listed in Table 1 and the coverage is shown in Fig. 1. The observations were made in May 2006 (Table 1). The coverage of the survey is homogeneous over the entire cluster and complete in the J = 12 − 19 mag range.
The GCS provides five-band photometry. In addition, we have computed proper motions from the ~6 year baseline between the 2MASS (observations taken between 26 April and 12 June 2000; Cutri et al. 2003) and GCS observations (May 2006) for all sources brighter than J = 15.5 mag. Furthermore, we have near-infrared photometry for 313 candidates (only six have no Z-band photomery) out of the 393 optical candidates in the I = 17.0 − 22.0 mag range, i.e. 77 − 78% of all the faint optical candidates whereas de Wit et al. (2006) presented (only) K-band photometry for 101 faint candidates (i.e. ~25%).
Log of the observations.
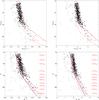 |
Fig. 3 Various colour–magnitude diagrams for ~4.3 square degree surveyed in IC 4665 by the UKIDSS Galactic Clusters Survey. Overplotted are the 30 and 100 Myr NextGen (solid line; Baraffe et al. 1998) and DUSTY (dashed line; Chabrier et al. 2000) isochrones shifted to a distance of 350 pc. Masses are given on the right-hand side of the plot for the 30 Myr isochrone. Overplotted are the lines for photometric selection as described in Sect. 4.2. Filled circles represent the optically selected member candidates from de Wit et al. (2006) confirmed by infrared photometry. Crosses are optically selected candidates rejected as cluster members on the basis of their infrared colours. Top left: (zCFH12K − J, zCFH12K) diagram. Top right: (zCFH12K − K, zCFH12K) diagram. Bottom left: (Z − J, Z) diagram. Bottom right: (Z − K, Z) diagram. Note that the 30 Myr NextGen and DUSTY isochrones are plotted on the top hand side diagrams with the set of filters indicated on the axis. |
4. Cross-matching with optical data
4.1. Optical-to-infrared colour–magnitude diagrams
The depth and coverage of the GCS observations allow us to provide infrared counterparts in five broad-band filters (ZYJHK) for the large majority of optical candidates down to the completeness limit of the CFH12K survey (~0.03 M⊙). As mentioned in the previous section, we have photometry for 313 out of the 393 (77−78%) optical candidates with I = 17.0−22.0 mag.
We have plotted various colour–magnitude diagrams using optical and infrared magnitudes to assess the membership of the optically selected candidates published in de Wit et al. (2006). On the left-hand side of Fig. 3 we show the (z − J, z) and the (Z − J, Z) colour − magnitude diagrams. The same diagrams are displayed for the z − K and Z − K colours on the right-hand side of Fig. 3. The majority of optical candidates rejected by the z − J and z − K colours are also discarded by the Z − J and Z − K colours, showing the efficiency of optical-to-infrared colours in removing interlopers (Fig. 3).
Additional colour–magnitude diagrams employed to reject photometric contaminants include the (Y − J, Y) and (J − K, J) presented in Fig. 4. We also examined the (H − K, J − H) colour − colour diagram to assess the nature of the contaminants. This diagram, not shown here, suggests that the contamination in the optical selection originates from a mixture of reddened early-type dwarfs and field M dwarfs.
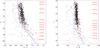 |
Fig. 4 (Y − J, Y) and (J − K, J) colour − magnitude diagrams for a ~4.3 square degree surveyed in IC 4665 by the GCS. Overplotted are the 30 Myr NextGen (solid line; Baraffe et al. 1998) and DUSTY (dashed line; Chabrier et al. 2000) isochrones shifted to a distance of 350 pc. Masses are given on the right-hand side of each plot for the 30 Myr isochrones. Filled circles represent the optically selected candidates from de Wit et al. (2006) whose membership is confirmed by their infrared photometry. Crosses are optically selected candidates rejected as cluster members on the basis of their infrared colours. Overplotted are the lines for photometric selection as described in Sect. 4.2. |
4.2. Revised membership of optically selected candidates
To verify the membership of the 785 optical candidates from de Wit et al. (2006) using our near-infrared photometry, we cross-matched that list with the full GCS catalogue with a matching radius of five arcsec and found 654 common objects. We found that 58 out 785 optical candidates lie in the region outside of GCS coverage. Therefore, 785−58 = 727 objects are within the GCS coverage, implying that 727−654 = 73 sources are not recovered by our GCS selection. The GCS detection of these 73 sources, located at the position of the optical source, did not satisfy the criteria set in the SQL query. We found that 19 of the 73 objects are missing photometry in (at least) one of the JHK passbands, and the remaining sources do not satisfy the point sources criteria (Class and ClassStat parameters in at least one filter). This problem is inherent to the SQL query and represents about 10% of the total number of candidates, a value slightly higher than for σOrionis (4.4−7.8%; Lodieu et al. 2009). We note that 35 out of the 54 (~65%) sources with ZYJHK magnitudes from GCS DR8 would remain as photometric member candidates after applying the colour selections described in the next paragraph.
We generated various colour–magnitude diagrams (Figs. 3 and 4) to design selection cuts based on the position of the 654 optical candidates with ZYJHK photometry. Looking at these candidates in the several colour − magnitude diagrams, we generated a subsample of candidates by extracting only those to the right of lines defined in each diagram below:
-
(Z − J, Z) = (0.72, 14.0) to (1.15, 17.8).
-
(Z − J, Z) = (1.15, 17.8) to (2.3, 21.5).
-
(Z − K, Z) = (1.5, 14.0) to (2.0, 17.5).
-
(Z − K, Z) = (2.0, 17.5) to (3.4, 21.5).
-
(Y − J, Y) = (0.45, 14.0) to (0.55, 17.0).
-
(Y − J, Y) = (0.55, 17.0) to (1.15, 20.5).
-
(Y − K, Y) = (1.3, 14.0) to (1.45, 17.0).
-
(Y − K, Y) = (1.45, 17.0) to (2.2, 20.5).
-
(J − K, J) ≥ 0.8 for J = 13–17 mag.
-
(J − K, J) = (0.8, 17.0) to (1.3, 19.5).
We are left with 493 optical candidates that satisfy those criteria, and accordingly we confirm their candidacy as photometric members on the basis of the five-band infrared photometry. This sample will be refered to as “high-probability members” in the rest of the paper. These members have a magnitude range that spans Z = 14.2−21.1 mag. Their coordinates, photometry and proper motions are available electronically and an example is shown in Table A.1. They are plotted as filled circles in Figs. 3 and 4. The other optical candidates, rejected as cluster members, are listed in Table B.1 and plotted as plus symbols in Figs. 3 and 4. Tables A.1 and B.1 list the names of each source according to the International Astronomical Union (IAU), the coordinates (in J2000), the optical (Iz) and infrared (ZYJHK) magnitudes, as well as the proper motions in right ascension and declination expressed in mas/yr. We emphasise that proper motions for objects fainter than J = 15.5 mag are unreliable because they are computed using 2MASS as first epoch and the GCS as a second epoch.
We compared the percentage of contaminants as a function of magnitude before and after applying the colour cuts above: we observe an increase in the level of contamination (from ~20% to ~50%) with decreasing luminosity in particular below Z = 17 mag (corresponding to 0.15 M⊙; Table 2), in agreement with the conclusions drawn by de Wit et al. (2006) from a limited sample of K-band observations and the study of two control fields (see also Moraux et al. 2003) in this open cluster located at lower galactic latitude and towards a dense region (see e.g. Prosser 1993). The most powerful selection criterion clearly is the Z − J colour because the other colour cuts remove on average less than 10% of the candidates (R2 percentage in Table 2).
We looked further into the level of contamination expected in the GCS data. We selected two control fields with galactic coordinates similar to IC 4665. These are located about 0.2 degrees outside the cluster radius determined by Kharchenko et al. (2005b). The two control fields contain 6610 and 7725 sources with ZYJHK photometry, respectively, compared to a total of 7220 sources in the central 0.16 square degrees in IC 4665. After applying the various selection cuts designed above, we are left with 89 candidates in the central region of the cluster compared with 57 and 50 candidates in the two control fields. The average level of contamination is of the order of 55−60% and is comparable in the bright and faint magnitude ranges. This level of contamination is very likely an upper limit because the control fields are located very close to the cluster, much closer than the control fields used in the optical study (0.2 vs. 3 degrees). The estimated contamination is higher than the levels derived for the Pleiades (Moraux et al. 2001) and Alpha Per (Barrado y Navascués et al. 2002), most likely because of the lower galactic latitude of IC 4665.
Number of optical candidates with GCS photometry (opt) for different intervals of Z magnitude after the different selection steps.
4.3. New cluster member candidates
Considering the low-mass and substellar sequence defined by the high-probability members, we have identified new candidates over the full area covered by the GCS. The same colour cuts as defined in Sect. 4.2 returned a total of 2236 sources with Z = 14.0−21.25 mag. Of the 2236 sources, 864 are outside the optical coverage whereas 1372 are located in the common area between the optical and GCS surveys, including the 493 optical candidates confirmed as photometric members by the GCS (Sect. 4.2). Hence, we have 1372−493 = 879 potential new candidates (643 are brighter than Z = 17.2 mag and 236 fainter).
What about these new objects? Many lie in the blue part of the selection in the (Z − J, Z) diagram, suggesting that the large majority are indeed non-members. This trend is also observed in the (Y − J, Y) diagram and clearly confirmed in the optical (i − zCFHT, iCFHT) diagram. Furthermore, 635 and 30 (=665) out of 879 have poor quality flags in the i and z filters, respectively. Of these 214 candidates, only 26 satisfy the colour criteria set by de Wit et al. (2006): 23 were not selected by the optical study because their quality flags were greater than 1, another one was excluded from the criteria set for the flux radius parameter in SEXtractor, and the remaining two (UGCS J174823.92 + 055254.3 and 174543.44 + 062225.5) were overlooked by de Wit et al. (2006). Therefore, if we consider all 879 (or 879−2) candidates selected from the GCS but unselected by the CFH12K survey, the level of contamination of the GCS selected in IC 4665 would be of the order of 64% (879/1372 or 877/1372), consistent with the 55−60% estimated from the control fields (Sect. 4.2).
Furthermore, we have 2236−1372 = 864 new candidates from the GCS located outside the optical coverage, including 664 brighter than Z = 17.2 mag and 200 fainter (Table C.1). If we consider the level of contamination inferred above (55−64%), we should expect around 239 − 299 probable members among 664 bright candidates and about 72−90 out of 200 at fainter magnitudes, but these estimates are purely statistical. Nevertheless, we can say that the probability of membership decreases with increasing distance from the selection line.
4.4. Radial distributions
To estimate the spatial distribution of the candidates selected from the UKIDSS data alone, we calculate the number of objects per square degree located within an annulus R,R + dR centred on the cluster centre α0 = 17h46m04s, δ0 = 5d38m53s (de Wit et al. 2006). The corresponding radial profile is shown in the left-hand side of Fig. 5. This distribution is then fitted by a King profile (King 1962) plus a constant assuming that the density of contaminants ncont is uniform: ![Mathematical equation: \begin{equation} n(x) = k\,\left[\frac{1}{\sqrt{1+x}} - \frac{1}{\sqrt{1+x_{t}}}\right]^2 + n_{\rm cont}, \end{equation}](/articles/aa/full_html/2011/08/aa16883-11/aa16883-11-eq69.png) (1)where k is a normalisation constant, x = (r/rc)2 and xt = (rt/rc)2. The distance from the cluster centre is r, rc the core radius and rt the tidal radius.
(1)where k is a normalisation constant, x = (r/rc)2 and xt = (rt/rc)2. The distance from the cluster centre is r, rc the core radius and rt the tidal radius.
To find the best fit minimizing χ2, we left all these parameters free, except for the tidal radius that we forced to be between 6.4 and 12.1 pc. Indeed, Piskunov et al. (2008) found the cluster tidal radius to be rt = 8.7 ± 2.3 pc or 10.7 ± 1.4 pc whether they measured it or calculated it from the semi-major axis. We thus found k = 2924 ± 189 sq. deg-1, rc = 12.1 ± 0.4 pc, rt = 12.1 ± 0.3 pc and ncont = 251 ± 8 per square degree. The total covered area being 6.26 square degrees, this corresponds to 1571 ± 50 contaminants over 2236 candidates, or a contamination level of 70.3 ± 2.3%, which is consistent with our estimate using control fields.
We performed the same analysis for the sample of candidates common to both the GCS and the CFH12K survey. The best fit gives k = 497 ± 40 sq. deg-1, rc = 4.3 ± 0.8 pc, rt = 12.1 ± 0.8 pc and ncont = 71 ± 7 per square degree (see right panel in Fig. 5). Again using that the common area is 3.475 square degrees, we find a contamination level of 50 ± 5%.
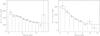 |
Fig. 5 Radial distributions for the full GCS coverage (left) and the common area between the GCS and the CFH12K surveys (right). |
4.5. Proper motions for the brightest member candidates
The mean proper motion of the IC 4665 cluster is estimated to be (μαcosδ, μδ) = (−0.57 ± 0.30, −7.40 ± 0.36) mas/yr from 30 members included in the study of Kharchenko et al. (2005b), in agreement with the average proper motion of 13 members measured by Hipparcos (Hoogerwerf et al. 2001). For more details, we refer the reader to the discussion in Sect. 4.1 of de Wit et al. (2006). Hence, the cluster’s motion is low and not easy to separate from field stars and reddened background giants. However, astrometric information can be used to reject photometric candidates with large proper motions.
We derived proper motions for all point sources identified in IC 4665 and brighter than J = 15.5 mag using 2MASS and the GCS as first and second epoch, respectively, thanks to the ~6 year baseline. We estimated the root mean square of the cross-match to better than 15 mas/yr for J ≤ 15.5 mag. We selected potential proper motion members among the photometric candidates, adopting a 3σ (corresponding to a total proper motion less than 45 mas/yr; Fig. 6) cut, which should optimize the selection (Lodieu et al. 2011).
Assuming those parameters, we are left with 278 out the 316 optical candidates brighter than J = 15.5 mag confirmed by the GCS as members, yielding a 10% contamination. Repeating this process for the new GCS candidates lying outside the CFH12K area, we would select 460 out of the 501 candidates with J ≤ 15.5 mag, again suggesting a contamination of 10%. A similar result is obtained for the sample of the GCS candidates with optical photometry that were not selected as potential members by the optical survey. To summarise, the overall level of contamination by proper motion non-members is of the order of 10%.
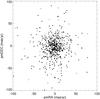 |
Fig. 6 Vector point diagram for all optical candidates confirmed as probable members by the GCS photometry (black dots) and photometric non-members (crosses). Typical error bars on the proper motion are 15 mas/yr. |
4.6. Fainter cluster member candidates
We attempted to identify fainter and lower mass candidates using sources that are Z-band non-detections. We applied the same colour criteria in Y − J, Y − K, and J − K colours as presented in Sect. 4.2. However, we limited our selection to J = 18.8 mag, the completeness of the GCS towards IC 4665. At this magnitude, point sources have a signal-to-noise ratio of the order of 6 − 8. The SQL query returned three potential candidates after removing those clearly detected on the Z images. However, two of them are actually detected on the deep CFH12K images (Table 3), suggesting that they do not belong to the cluster. These three candidates are listed at the top of Table 3.
We repeated the same procedure for Z and Y non-detections, using the J − K colour as sole criterion. The query returned two good candidates after removal of objects located at the edge of the detector and those clearly detected on the Z and Y images. These two candidates are listed at the bottom of Table 3.
We repeated those selections in the cluster centre and the two control fields, but the few objects returned in each area were all detected in Z for the YJHK candidates and in Z and Y for the JHK candidates.
Faint YJHK (top) and JHK (bottom) candidates identified in the UKIDSS GCS.
5. The luminosity and mass functions
In this section, we derive the cluster luminosity and mass functions based on the sample of optical photometric candidates confirmed by the GCS photometry. This sample contains the 493 cluster member candidates discussed in Sect. 4.2. We did not correct the luminosity and mass function for the level of contamination estimated in Sect. 4.5 because this sample represents the highest quality sample extracted to date. We expect a low level of contamination in this photometric sample, which combines optical and near-infrared photometry: about 10% of them may be proper motion non-members (see Sect. 4.5) and another 5−10% spectroscopic non-members according to our spectroscopic study of Upper Sco (Lodieu et al. 2011). An independent photometric and spectroscopic study of Blanco 1 by Moraux et al. (2007) suggests that the expected number of contaminants is low after combining optical and infrared photometric bands.
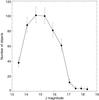 |
Fig. 7 Cluster luminosity function: number of objects as a function of J magnitude (Table 4). Error bars are Gehrels errors. |
5.1. The luminosity function
This sample of optical photometric candidates with infrared photometry contains 493 sources in the J ~ 13.1−18.6 mag. Adopting the lithium age of 27 Myr derived by Manzi et al. (2008) for IC 4665, the stellar/substellar limit is at K = 15.55 mag (or J = 16.49 mag) adopting a distance of 350 pc and choosing the 30 Myr available in the NextGen (Baraffe et al. 1998) and DUSTY (Chabrier et al. 2000) models to be most consistent with the age of the cluster. Thus, our sample contains ~91% of stars and 8−9% (40−46 out of 493) substellar candidates.
Figure 7 displays the luminosity function, i.e. the number of stars as a function of J magnitude. The number of objects increases up to J ~ 15 mag, then decreases down to J ~ 17.5 mag, and remains flat afterwards. Error bars are Gehrels errors (Gehrels 1986) rather than Poissonian error bars because the former represent a better approximation to the true error for small numbers. The upper limit is defined as  and the lower limit as
  assuming a confidence level of one sigma.
Numbers for the luminosity and mass functions.
5.2. The mass function
To convert magnitudes into masses we used the NextGen and DUSTY models at 30 Myr from the Lyon group (Baraffe et al. 1998; Chabrier et al. 2000). Estimated masses at a given magnitude and directly taken from the mass-magnitude relationship extracted from the models. Samples of masses are shown on the right-hand side of the colour-magnitude diagrams in Fig. 3. We used those relations to derive masses and construct the mass function. The highest mass cluster member candidate has ~0.66 M⊙ and the lowest mass object has 0.021 M⊙, the latter being outside the magnitude and mass ranges shown in Table 4. We did not attempt to correct the mass function for binaries. If IC 4665 is indeed a pre-main-sequence cluster, the current system mass function should reproduce the IMF fairly well (Salpeter 1955; Miller & Scalo 1979; Scalo 1986).
Figure 8 shows the system mass function for IC 4665 over the 0.66 − 0.02 M⊙ mass range (filled circles and solid line). The mass function in logarithmic scale peaks around 0.25−0.16 M⊙ and decreases down to our completeness limit at ~0.035 M⊙ (dot-dashed line in Fig. 8). The completeness in terms of mass is similar to our study in the Pleiades (red open diamonds and solid line; Lodieu et al. 2007a) because the difference in age between the Pleiades and IC 4665 (125 Myr vs. 27 Myr) is partly compensated by the larger distance of IC 4665 (Hoogerwerf et al. 2001). The penultimate point is probably real and lies higher than the point before at higher masses. The same trend is observed in the previous mass function in IC 4665 published by de Wit et al. (2006) as well as in the Pleiades mass function. Moraux et al. (2007) pointed out that this rise is not caused by an intrinsic rise of the mass function but rather reflects a drop in the mass-luminosity relationship owing to the onset of dust in the atmospheres of low-mass stars (the M7/M8 gap as defined by Dobbie et al. 2002c). The last point of our mass function, however, suffers from incompleteness and represents a lower limit because the mass range is below our completeness limit (Table 4). Similarly, the first point of the mass function is incomplete because of the saturation of the deep CFH12K images (de Wit et al. 2006).
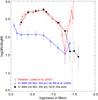 |
Fig. 8 Cluster mass function assuming an age of 30 Myr (Manzi et al. 2008) and a distance of 350 pc. The conversion from magnitudes into masses made use of the NextGen and DUSTY models (Baraffe et al. 1998; Chabrier et al. 2000). Values are given in Table 4. The vertical dot-dashed lines represent the GCS completeness limits in IC 4665. |
In Fig. 8 we overplotted the published mass function (blue open triangles and solid line) of IC 4665 by de Wit et al. (2006). The main difference lies in the choice of the age: we have used the recent age estimate of ~30 Myr (Manzi et al. 2008) based on the lithium method (Rebolo et al. 1992; Basri et al. 1996), whereas de Wit et al. (2006) showed the mass function for 50 and 100 Myr following the earlier work by Prosser (1993). We emphasise the large uncertainty on the distance of IC 4665 (385 ± 40 pc; Hoogerwerf et al. 2001). This range in distance would translate into a shift in mass with small differences in the substellar regime (~0.005 M⊙) but more significant at higher masses (several tens of Jupiter masses for masses larger than 0.5 M⊙). We observe a sharper decline of the mass function derived from the GCS data than the one derived by de Wit et al. (2006), suggesting that the level of contamination of the optical survey below 0.1 M⊙ was higher than the one estimated by this study despite the correction applied by de Wit et al. (2006).
The mass function derived in our study is very similar to the Pleiades mass function drawn from the GCS dataset (Lodieu et al. 2007a) down to 0.05 M⊙. Both mass functions peak around the same mass (between 0.16 M⊙ and 0.25 M⊙) followed by a decrease down to the completeness limit of the GCS survey. The difference in mass observed at the M7/M8 gap (0.05 M⊙ for the Pleiades vs. 0.035 M⊙ for IC 4665) could arise from the large uncertainty on the distance of IC 4665 (40 pc; Hoogerwerf et al. 2001) compared to the 5 pc error on the Pleiades’s distance (Johnson 1957; Gatewood et al. 2000; Southworth et al. 2005). Moreover, the Pleiades mass function was based on a photometric and proper motion sample, whereas the IC 4665 dataset is purely photometric because we do not have proper motion over the full magnitude range probed by the GCS.
6. Conclusions and future work
We have presented the outcome of a wide-field near-infrared survey of IC 4665 conducted by the UKIDSS Galactic Clusters Survey. The cross-matching of the GCS survey with a previous optical survey to a similar depth leads to a revision of the membership of low-mass stars and brown dwarfs in IC 4665 based on their optical-to-infrared and infrared colours. The main results of this paper can be summarised as follows:
-
1.
We confirmed a total of 493 photometric candidates identifiedin a pure optical survey as high-probability member candidatesusing five infrared (ZYJHK) filters in addition to the two optical (Iz) passbands.
-
2.
We identified new cluster member candidates in a previously unstudied region of the cluster.
-
3.
We derived the luminosity and mass functions in the J = 13.1 − 18.6 mag range, corresponding to masses of 0.66 and 0.02 M⊙ at an age of 30 Myr and a distance of 350 pc.
-
4.
We found that the mass function is similar in shape to the Pleiades. It is best represented by a lognormal function peaking around 0.25 − 0.16 M⊙ over the 0.66 − 0.04 M⊙ mass range.
The full area of the cluster will be observed again in K as part of the GCS, which will provide additional proper motion measurements over the full magnitude range to add proper motion information to the photometric selection. We are planning an optical spectroscopic follow-up with the AAOmega multi-fibre spectrograph installed on the 3.9-m Australian Astronomical Telescope (Lewis et al. 2002; Sharp et al. 2006) to confirm the membership of all optical and GCS candidates. This spectroscopic follow-up will provide (i) a full spectroscopic mass function from 0.65 to 0.04 M⊙; (ii) a better estimate of the level of contamination in the optical and GCS surveys; and (iii) a full spectroscopic sequence of 30 Myr-old late-M dwarfs. Moreover, optical and near-infrared spectroscopy of IC 4665 members will be extremely valuable to bridge the gap between star-forming regions like Upper Sco (5 Myr; Preibisch & Zinnecker 2002) and older open clusters like the Pleiades (125 Myr; Stauffer et al. 1998) to define a temperature scale at 30 Myr. For this reason, IC 4665 can serve as a benchmark to study the evolution of the binary properties in the substellar regime, investigate the role of gravity as a function of age, the evolution of disks, and test current evolutionary models. Finally, deeper surveys of IC 4665 may reveal late-L and T dwarf photometric candidates of intermediate age that would be ideal targets for photometric and spectroscopic studies with upcoming facilities such as the E-ELT and James Webb Space Telescope.
More details at www.ukidss.org.
Extensive details on the data reduction of the UKIDSS images is available at http://casu.ast.cam.ac.uk/surveys-projects/wfcam/technical, see also Irwin et al. (2004).
Acknowledgments
N.L. acknowledges funding from the Spanish Ministry of Science and Innovation through the Ramón y Cajal fellowship number 08-303-01-02 and the national program AYA2010-19136. N.L. thanks ESO for the short but productive stay in May 2008 and the LAOG for his visit in December 2010. We are grateful to Isabelle Baraffe for providing us with the NextGen and DUSTY models for the CFHT/CFH12K and UKIRT/WFCAM filters. We thank David Pinfield for his comments that improved the content of the paper. This research has made use of the Simbad database, operated at the Centre de Données Astronomiques de Strasbourg (CDS), and of NASA’s Astrophysics Data System Bibliographic Services (ADS) and the 2MASS database. This work is based in part on data from UKIDSS project and the CFH12K camera. The United Kingdom Infrared Telescope is operated by the Joint Astronomy Centre on behalf of the UK Science Technology and Facility Council. The Canada-France-Hawaii Telescope (CFHT) is operated by the National Research Council of Canada, the Institut National des Sciences de l’Univers of the Centre National de la Recherche Scientifique of France, and the University of Hawaii.
References
- Abt, H. A., & Chaffee, F. H. 1967, ApJ, 148, 459 [NASA ADS] [CrossRef] [Google Scholar]
- Adams, J. D., Stauffer, J. R., Monet, D. G., Skrutskie, M. F., & Beichman, C. A. 2001, AJ, 121, 2053 [NASA ADS] [CrossRef] [Google Scholar]
- Baker, D. E. A., Jameson, R. F., Casewell, S. L., et al. 2010, MNRAS, 408, 2457 [NASA ADS] [CrossRef] [Google Scholar]
- Baraffe, I., Chabrier, G., Allard, F., & Hauschildt, P. H. 1998, A&A, 337, 403 [NASA ADS] [Google Scholar]
- Barrado y Navascués, D., Stauffer, J. R., Bouvier, J., & Martín, E. L. 2001a, ApJ, 546, 1006 [NASA ADS] [CrossRef] [Google Scholar]
- Barrado y Navascués, D., Stauffer, J. R., Briceño, C., et al. 2001b, ApJS, 134, 103 [NASA ADS] [CrossRef] [Google Scholar]
- Barrado y Navascués, D., Bouvier, J., Stauffer, J. R., Lodieu, N., & McCaughrean, M. J. 2002, A&A, 395, 813 [NASA ADS] [CrossRef] [EDP Sciences] [Google Scholar]
- Barrado y Navascués, D., Stauffer, J. R., & Jayawardhana, R. 2004, ApJ, 614, 386 [NASA ADS] [CrossRef] [Google Scholar]
- Basri, G., Marcy, G. W., & Graham, J. R. 1996, ApJ, 458, 600 [NASA ADS] [CrossRef] [Google Scholar]
- Béjar, V. J. S., Martín, E. L., Zapatero Osorio, M. R., et al. 2001, ApJ, 556, 830 [NASA ADS] [CrossRef] [Google Scholar]
- Bihain, G., Rebolo, R., Béjar, V. J. S., et al. 2006, A&A, 458, 805 [NASA ADS] [CrossRef] [EDP Sciences] [Google Scholar]
- Bihain, G., Rebolo, R., Zapatero Osorio, M. R., Béjar, V. J. S., & Caballero, J. A. 2010, A&A, 519, A93 [NASA ADS] [CrossRef] [EDP Sciences] [Google Scholar]
- Bouvier, J., Stauffer, J. R., Martín, E. L., et al. 1998, A&A, 336, 490 [NASA ADS] [Google Scholar]
- Bouvier, J., Kendall, T., Meeus, G., et al. 2008, A&A, 481, 661 [NASA ADS] [CrossRef] [EDP Sciences] [Google Scholar]
- Caballero, J. A., Béjar, V. J. S., Rebolo, R., et al. 2007, A&A, 470, 903 [NASA ADS] [CrossRef] [EDP Sciences] [Google Scholar]
- Cargile, P. A., & James, D. J. 2010, AJ, 140, 677 [NASA ADS] [CrossRef] [Google Scholar]
- Casali, M., Adamson, A., Alves de Oliveira, C., et al. 2007, A&A, 467, 777 [NASA ADS] [CrossRef] [EDP Sciences] [Google Scholar]
- Chabrier, G. 2003, PASP, 115, 763 [NASA ADS] [CrossRef] [Google Scholar]
- Chabrier, G., Baraffe, I., Allard, F., & Hauschildt, P. 2000, ApJ, 542, 464 [NASA ADS] [CrossRef] [Google Scholar]
- Cutri, R. M., Skrutskie, M. F., van Dyk, S., et al. 2003, 2MASS All Sky Catalog of point sources, 2246 [Google Scholar]
- Dambis, A. K. 1999, Astron. Lett., 25, 7 [NASA ADS] [Google Scholar]
- de Wit, W. J., Bouvier, J., Palla, F., et al. 2006, A&A, 448, 189 [NASA ADS] [CrossRef] [EDP Sciences] [Google Scholar]
- Deacon, N. R., & Hambly, N. C. 2004, A&A, 416, 125 [NASA ADS] [CrossRef] [EDP Sciences] [Google Scholar]
- Dobbie, P. D., Kenyon, F., Jameson, R. F., et al. 2002a, MNRAS, 329, 543 [NASA ADS] [CrossRef] [Google Scholar]
- Dobbie, P. D., Kenyon, F., Jameson, R. F., et al. 2002b, MNRAS, 335, 687 [NASA ADS] [CrossRef] [Google Scholar]
- Dobbie, P. D., Pinfield, D. J., Jameson, R. F., & Hodgkin, S. T. 2002c, MNRAS, 335, L79 [NASA ADS] [CrossRef] [Google Scholar]
- Epchtein, N., de Batz, B., & Capoani, L. E. 1997, The Messenger, 87, 27 [NASA ADS] [Google Scholar]
- Gatewood, G., de Jonge, J. K., & Han, I. 2000, ApJ, 533, 938 [NASA ADS] [CrossRef] [Google Scholar]
- Gehrels, N. 1986, ApJ, 303, 336 [NASA ADS] [CrossRef] [Google Scholar]
- Hambly, N. C., Hodgkin, S. T., Cossburn, M. R., & Jameson, R. F. 1999, MNRAS, 303, 835 [NASA ADS] [CrossRef] [Google Scholar]
- Hambly, N. C., Collins, R. S., Cross, N. J. G., et al. 2008, MNRAS, 384, 637 [NASA ADS] [CrossRef] [Google Scholar]
- Hewett, P. C., Warren, S. J., Leggett, S. K., & Hodgkin, S. T. 2006, MNRAS, 367, 454 [NASA ADS] [CrossRef] [Google Scholar]
- Hoogerwerf, R., de Bruijne, J. H. J., & de Zeeuw, P. T. 2001, A&A, 365, 49 [NASA ADS] [CrossRef] [EDP Sciences] [Google Scholar]
- Irwin, M. J., Lewis, J., Hodgkin, S., et al. 2004, in Optimizing Scientific Return for Astronomy through Information Technologies, ed. P. J. Quinn & A. Bridger, Proc. SPIE, 5493, 411 [Google Scholar]
- Jeffries, R. D., & Oliveira, J. M. 2005, MNRAS, 358, 13 [NASA ADS] [CrossRef] [Google Scholar]
- Jeffries, R. D., Naylor, T., Devey, C. R., & Totten, E. J. 2004, MNRAS, 351, 1401 [NASA ADS] [CrossRef] [Google Scholar]
- Johnson, H. L. 1957, ApJ, 126, 121 [NASA ADS] [CrossRef] [Google Scholar]
- Kharchenko, N. V., Piskunov, A. E., Röser, S., Schilbach, E., & Scholz, R.-D. 2005a, A&A, 438, 1163 [NASA ADS] [CrossRef] [EDP Sciences] [MathSciNet] [Google Scholar]
- Kharchenko, N. V., Piskunov, A. E., Röser, S., Schilbach, E., & Scholz, R.-D. 2005b, A&A, 438, 1163 [NASA ADS] [CrossRef] [EDP Sciences] [MathSciNet] [Google Scholar]
- King, I. 1962, AJ, 67, 471 [NASA ADS] [CrossRef] [Google Scholar]
- Kroupa, P. 2002, Science, 295, 82 [NASA ADS] [CrossRef] [PubMed] [Google Scholar]
- Larson, R. B. 2005, MNRAS, 359, 211 [NASA ADS] [CrossRef] [Google Scholar]
- Lawrence, A., Warren, S. J., Almaini, O., et al. 2007, MNRAS, 379, 1599 [NASA ADS] [CrossRef] [MathSciNet] [Google Scholar]
- Lewis, I. J., Cannon, R. D., Taylor, K., et al. 2002, MNRAS, 333, 279 [NASA ADS] [CrossRef] [Google Scholar]
- Lodieu, N., McCaughrean, M. J., Barrado Y Navascués, D., Bouvier, J., & Stauffer, J. R. 2005, A&A, 436, 853 [NASA ADS] [CrossRef] [EDP Sciences] [Google Scholar]
- Lodieu, N., Hambly, N. C., & Jameson, R. F. 2006, MNRAS, 373, 95 [NASA ADS] [CrossRef] [Google Scholar]
- Lodieu, N., Dobbie, P. D., Deacon, N. R., et al. 2007a, MNRAS, 380, 712 [NASA ADS] [CrossRef] [Google Scholar]
- Lodieu, N., Hambly, N. C., Jameson, R. F., et al. 2007b, MNRAS, 374, 372 [NASA ADS] [CrossRef] [Google Scholar]
- Lodieu, N., Hambly, N. C., Jameson, R. F., & Hodgkin, S. T. 2008, MNRAS, 383, 1385 [NASA ADS] [CrossRef] [Google Scholar]
- Lodieu, N., Zapatero Osorio, M. R., Rebolo, R., Martín, E. L., & Hambly, N. C. 2009, A&A, 505, 1115 [NASA ADS] [CrossRef] [EDP Sciences] [Google Scholar]
- Lodieu, N., Dobbie, P. D., & Hambly, N. C. 2011, A&A, 527, A24 [NASA ADS] [CrossRef] [EDP Sciences] [Google Scholar]
- Lynga, G. 1995, VizieR Online Data Catalog, 7092, [Google Scholar]
- Manzi, S., Randich, S., de Wit, W. J., & Palla, F. 2008, A&A, 479, 141 [NASA ADS] [CrossRef] [EDP Sciences] [Google Scholar]
- Martín, E. L., Rebolo, R., & Zapatero Osorio, M. R. 1996, ApJ, 469, 706 [NASA ADS] [CrossRef] [Google Scholar]
- Martín, E. L., Zapatero Osorio, M. R., & Rebolo, R. 1998, in Brown Dwarfs and Extrasolar Planets, ed. R. Rebolo, E. L. Martín, & M. R. Zapatero Osorio, ASP Conf. Ser., 134, 507 [Google Scholar]
- Mermilliod, J. C. 1981, A&A, 97, 235 [NASA ADS] [Google Scholar]
- Miller, G. E., & Scalo, J. M. 1979, ApJS, 41, 513 [NASA ADS] [CrossRef] [Google Scholar]
- Montes, D., & Martin, E. L. 1998, A&AS, 128, 485 [NASA ADS] [CrossRef] [EDP Sciences] [Google Scholar]
- Moraux, E., Bouvier, J., & Stauffer, J. R. 2001, A&A, 367, 211 [NASA ADS] [CrossRef] [EDP Sciences] [Google Scholar]
- Moraux, E., Bouvier, J., Stauffer, J. R., & Cuillandre, J.-C. 2003, A&A, 400, 891 [NASA ADS] [CrossRef] [EDP Sciences] [Google Scholar]
- Moraux, E., Bouvier, J., Stauffer, J. R., Barrado y Navascués, D., & Cuillandre, J.-C. 2007, A&A, 471, 499 [NASA ADS] [CrossRef] [EDP Sciences] [Google Scholar]
- Naylor, T., Totten, E. J., Jeffries, R. D., et al. 2002, MNRAS, 335, 291 [NASA ADS] [CrossRef] [Google Scholar]
- Piskunov, A. E., Schilbach, E., Kharchenko, N. V., Röser, S., & Scholz, R. 2008, A&A, 477, 165 [NASA ADS] [CrossRef] [EDP Sciences] [Google Scholar]
- Preibisch, T., & Zinnecker, H. 2002, AJ, 123, 1613 [NASA ADS] [CrossRef] [Google Scholar]
- Prosser, C. F. 1993, AJ, 105, 1441 [NASA ADS] [CrossRef] [Google Scholar]
- Rebolo, R., Martín, E. L., & Magazzù, A. 1992, ApJ, 389, L83 [NASA ADS] [CrossRef] [Google Scholar]
- Salpeter, E. E. 1955, ApJ, 121, 161 [Google Scholar]
- Scalo, J. M. 1986, Fundamentals of Cosmic Physics, 11, 1 [Google Scholar]
- Sharp, R., Saunders, W., Smith, G., et al. 2006, in Ground-based and Airborne Instrumentation for Astronomy, ed. I. S. McLean, & M. Iye, Proc. SPIE, SPIE Conf., 6269, 62690G [Google Scholar]
- Southworth, J., Maxted, P. F. L., & Smalley, B. 2005, A&A, 429, 645 [NASA ADS] [CrossRef] [EDP Sciences] [Google Scholar]
- Spezzi, L., Pagano, I., Marino, G., et al. 2009, A&A, 499, 541 [NASA ADS] [CrossRef] [EDP Sciences] [Google Scholar]
- Stauffer, J. R., Schultz, G., & Kirkpatrick, J. D. 1998, ApJ, 499, L219 [CrossRef] [Google Scholar]
- Stauffer, J. R., Barrado y Navascués, D., Bouvier, J., et al. 1999, ApJ, 527, 219 [NASA ADS] [CrossRef] [Google Scholar]
- Steele, I. A., & Jameson, R. F. 1995, MNRAS, 272, 630 [NASA ADS] [Google Scholar]
- Tej, A., Sahu, K. C., Chandrasekhar, T., & Ashok, N. M. 2002, ApJ, 578, 523 [NASA ADS] [CrossRef] [Google Scholar]
- Tokunaga, A. T., Simons, D. A., & Vacca, W. D. 2002, PASP, 114, 180 [NASA ADS] [CrossRef] [Google Scholar]
- Zapatero Osorio, M. R., Martín, E. L., & Rebolo, R. 1997, A&A, 323, 105 [NASA ADS] [Google Scholar]
- Zapatero Osorio, M. R., Rebolo, R., Martín, E. L., et al. 1999, A&AS, 134, 537 [NASA ADS] [CrossRef] [EDP Sciences] [Google Scholar]
Appendix A: Optical candidates confirmed by infrared photometry
Coordinates, optical and near-infrared photometry, proper motions (in mas/yr), luminosities (in L/L⊙), and mass (in M⊙) for the 493 optically selected cluster member candidates in IC 4665 confirmed as such by their infrared colours extracted from the Eighth Data Release of the UKIDSS Galactic Clusters Survey.
Appendix B: Optical candidates rejected by infrared photometry
Coordinates, optical and near-infrared photometry, and proper motions for 161 optically selected candidates in IC 4665 classified as photometric non-members based on their infrared colours extracted from the Eighth Data Release of the UKIDSS Galactic Clusters Survey.
Appendix C: New photometric candidates identified in the GCS
Coordinates and near-infrared photometry for the new cluster member candidates in IC 4665 extracted from the UKIDSS GCS DR8.
All Tables
Number of optical candidates with GCS photometry (opt) for different intervals of Z magnitude after the different selection steps.
Coordinates, optical and near-infrared photometry, proper motions (in mas/yr), luminosities (in L/L⊙), and mass (in M⊙) for the 493 optically selected cluster member candidates in IC 4665 confirmed as such by their infrared colours extracted from the Eighth Data Release of the UKIDSS Galactic Clusters Survey.
Coordinates, optical and near-infrared photometry, and proper motions for 161 optically selected candidates in IC 4665 classified as photometric non-members based on their infrared colours extracted from the Eighth Data Release of the UKIDSS Galactic Clusters Survey.
Coordinates and near-infrared photometry for the new cluster member candidates in IC 4665 extracted from the UKIDSS GCS DR8.
All Figures
|
Fig. 1 Schematic view of the UKIDSS GCS coverage in IC 4665 is shown with thick solid lines. We included known high probability photometric candidates (star symbols) from Prosser (1993), the optical (I,z) candidates de Wit et al. (2006) confirmed (filled circles) and rejected (plus symbols) by the GCS photometry, as well as new photometric candidates identified in the GCS outside the optical coverage (open triangles). A more detailed view of the optical coverage is shown in Fig. 2 of de Wit et al. (2006). |
| In the text | |
|
Fig. 2 (Z − J, Z) colour–magnitude diagram for 4.3 square degrees surveyed in IC 4665 by the UKIDSS GCS. One out of 10 sources is plotted. |
| In the text | |
|
Fig. 3 Various colour–magnitude diagrams for ~4.3 square degree surveyed in IC 4665 by the UKIDSS Galactic Clusters Survey. Overplotted are the 30 and 100 Myr NextGen (solid line; Baraffe et al. 1998) and DUSTY (dashed line; Chabrier et al. 2000) isochrones shifted to a distance of 350 pc. Masses are given on the right-hand side of the plot for the 30 Myr isochrone. Overplotted are the lines for photometric selection as described in Sect. 4.2. Filled circles represent the optically selected member candidates from de Wit et al. (2006) confirmed by infrared photometry. Crosses are optically selected candidates rejected as cluster members on the basis of their infrared colours. Top left: (zCFH12K − J, zCFH12K) diagram. Top right: (zCFH12K − K, zCFH12K) diagram. Bottom left: (Z − J, Z) diagram. Bottom right: (Z − K, Z) diagram. Note that the 30 Myr NextGen and DUSTY isochrones are plotted on the top hand side diagrams with the set of filters indicated on the axis. |
| In the text | |
|
Fig. 4 (Y − J, Y) and (J − K, J) colour − magnitude diagrams for a ~4.3 square degree surveyed in IC 4665 by the GCS. Overplotted are the 30 Myr NextGen (solid line; Baraffe et al. 1998) and DUSTY (dashed line; Chabrier et al. 2000) isochrones shifted to a distance of 350 pc. Masses are given on the right-hand side of each plot for the 30 Myr isochrones. Filled circles represent the optically selected candidates from de Wit et al. (2006) whose membership is confirmed by their infrared photometry. Crosses are optically selected candidates rejected as cluster members on the basis of their infrared colours. Overplotted are the lines for photometric selection as described in Sect. 4.2. |
| In the text | |
|
Fig. 5 Radial distributions for the full GCS coverage (left) and the common area between the GCS and the CFH12K surveys (right). |
| In the text | |
|
Fig. 6 Vector point diagram for all optical candidates confirmed as probable members by the GCS photometry (black dots) and photometric non-members (crosses). Typical error bars on the proper motion are 15 mas/yr. |
| In the text | |
|
Fig. 7 Cluster luminosity function: number of objects as a function of J magnitude (Table 4). Error bars are Gehrels errors. |
| In the text | |
|
Fig. 8 Cluster mass function assuming an age of 30 Myr (Manzi et al. 2008) and a distance of 350 pc. The conversion from magnitudes into masses made use of the NextGen and DUSTY models (Baraffe et al. 1998; Chabrier et al. 2000). Values are given in Table 4. The vertical dot-dashed lines represent the GCS completeness limits in IC 4665. |
| In the text | |
Current usage metrics show cumulative count of Article Views (full-text article views including HTML views, PDF and ePub downloads, according to the available data) and Abstracts Views on Vision4Press platform.
Data correspond to usage on the plateform after 2015. The current usage metrics is available 48-96 hours after online publication and is updated daily on week days.
Initial download of the metrics may take a while.