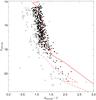
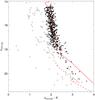
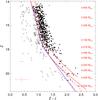
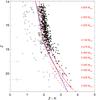
Fig. 3

Various colour–magnitude diagrams for ~4.3 square degree surveyed in IC 4665 by the UKIDSS Galactic Clusters Survey. Overplotted are the 30 and 100 Myr NextGen (solid line; Baraffe et al. 1998) and DUSTY (dashed line; Chabrier et al. 2000) isochrones shifted to a distance of 350 pc. Masses are given on the right-hand side of the plot for the 30 Myr isochrone. Overplotted are the lines for photometric selection as described in Sect. 4.2. Filled circles represent the optically selected member candidates from de Wit et al. (2006) confirmed by infrared photometry. Crosses are optically selected candidates rejected as cluster members on the basis of their infrared colours. Top left: (zCFH12K − J, zCFH12K) diagram. Top right: (zCFH12K − K, zCFH12K) diagram. Bottom left: (Z − J, Z) diagram. Bottom right: (Z − K, Z) diagram. Note that the 30 Myr NextGen and DUSTY isochrones are plotted on the top hand side diagrams with the set of filters indicated on the axis.
Current usage metrics show cumulative count of Article Views (full-text article views including HTML views, PDF and ePub downloads, according to the available data) and Abstracts Views on Vision4Press platform.
Data correspond to usage on the plateform after 2015. The current usage metrics is available 48-96 hours after online publication and is updated daily on week days.
Initial download of the metrics may take a while.