Fig. 3
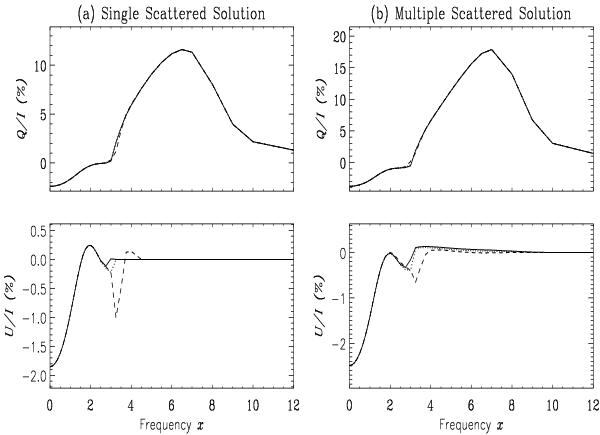
The effect of three types of frequency domains on Q/I and U/I profiles computed using angle-dependent PRD functions. Solid lines correspond to the 1D cut-off assumption (xc = 3), dotted lines to 2D square domains ( ), and dashed lines to the approximation-II of Bommier (1997b). The model parameters are the same as in Fig. 2a. Panel a) corresponds to single scattered solutions, and panel b) to the multiple scattered solutions.
Current usage metrics show cumulative count of Article Views (full-text article views including HTML views, PDF and ePub downloads, according to the available data) and Abstracts Views on Vision4Press platform.
Data correspond to usage on the plateform after 2015. The current usage metrics is available 48-96 hours after online publication and is updated daily on week days.
Initial download of the metrics may take a while.