Fig. 6
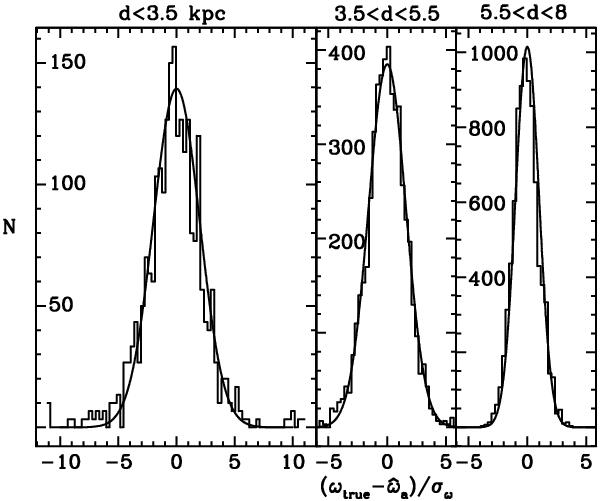
Histogram of the relative error in the single-star parallax (( ) resulting from the addition of surface brightness asymmetries for supergiant stars at different distances. The distribution for stars in the right panel (d > 5.5 kpc) closely reproduces the expected N(0,1). In the central panel (3.5 < d < 5.5 kpc), the distribution is wider with a best-fit N(0,2.5). Finally, for the left panel (d < 3.5 kpc) the σ of the distribution increases to four. Parameters of the Markov chain used here are σP = 0.09 AU and τ = 4 × 10⁶ s. The x-axes in the three panels are at the same scale.
Current usage metrics show cumulative count of Article Views (full-text article views including HTML views, PDF and ePub downloads, according to the available data) and Abstracts Views on Vision4Press platform.
Data correspond to usage on the plateform after 2015. The current usage metrics is available 48-96 hours after online publication and is updated daily on week days.
Initial download of the metrics may take a while.