Fig. 5
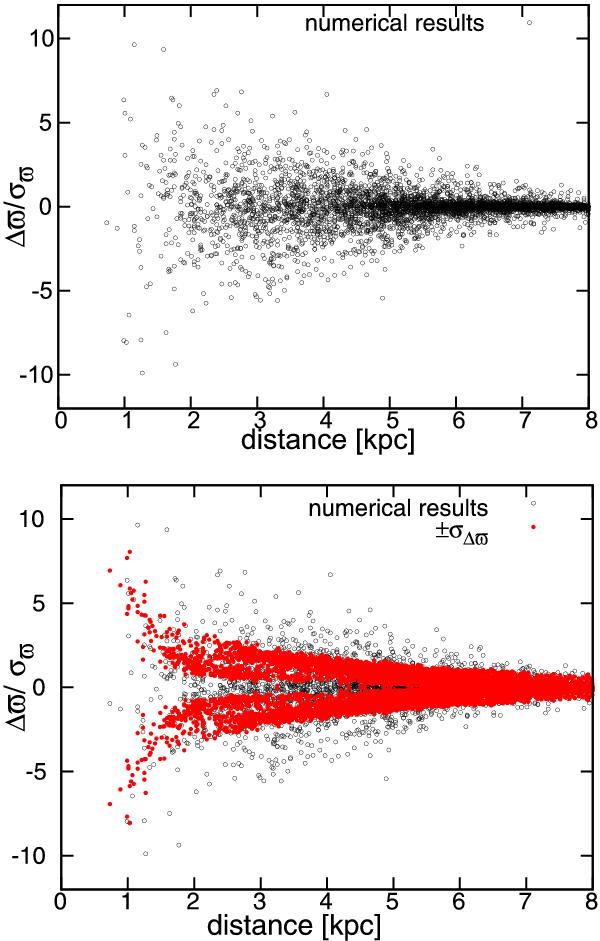
Upper panel: relative variation in the single-star parallax ( ) resulting from the addition of surface brightness asymmetries. Lower panel: same as upper panel but with the standard deviation predicted from Eq. (5) added (red points). The parameters of the Markov chain used to generate the data are σP = 0.09 AU and τ = 4 × 10⁶ s.
Current usage metrics show cumulative count of Article Views (full-text article views including HTML views, PDF and ePub downloads, according to the available data) and Abstracts Views on Vision4Press platform.
Data correspond to usage on the plateform after 2015. The current usage metrics is available 48-96 hours after online publication and is updated daily on week days.
Initial download of the metrics may take a while.