Free Access
Fig. 3
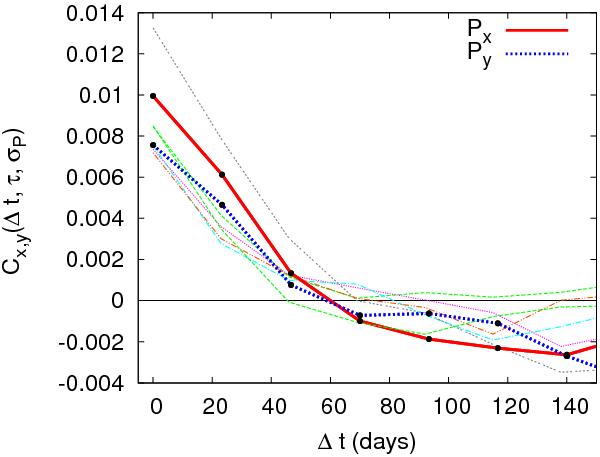
Thick lines: correlation function of the projections of the photocentre positions extracted from the 3D model. Thin lines: correlation function of simulated photocentre positions generated with an exponentially decreasing correlation function (see Eq. (3)) with σP ≃ 0.09 AU and τ ≃ 2 − 4 × 10⁶ s sampled every 23 days.
Current usage metrics show cumulative count of Article Views (full-text article views including HTML views, PDF and ePub downloads, according to the available data) and Abstracts Views on Vision4Press platform.
Data correspond to usage on the plateform after 2015. The current usage metrics is available 48-96 hours after online publication and is updated daily on week days.
Initial download of the metrics may take a while.