Fig. 11
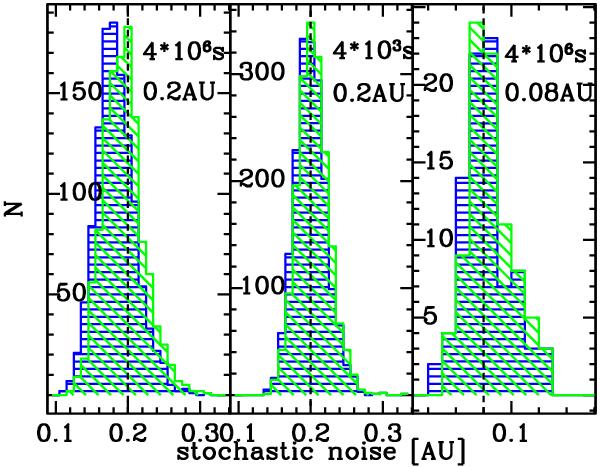
The blue horizontally striped histograms show the “stochastic” noise added to Gaia measurements in the computation of a stochastic solution. The green diagonally striped ones represent the stochastic noise plus the offset of the mean photocentre position with respect to the centre of the star. The three panels show results for three different sets of parameters of the Markov chain. The vertical dashed line corresponds to the standard deviation σP in the photocentre displacement.
Current usage metrics show cumulative count of Article Views (full-text article views including HTML views, PDF and ePub downloads, according to the available data) and Abstracts Views on Vision4Press platform.
Data correspond to usage on the plateform after 2015. The current usage metrics is available 48-96 hours after online publication and is updated daily on week days.
Initial download of the metrics may take a while.