Free Access
Fig. 9
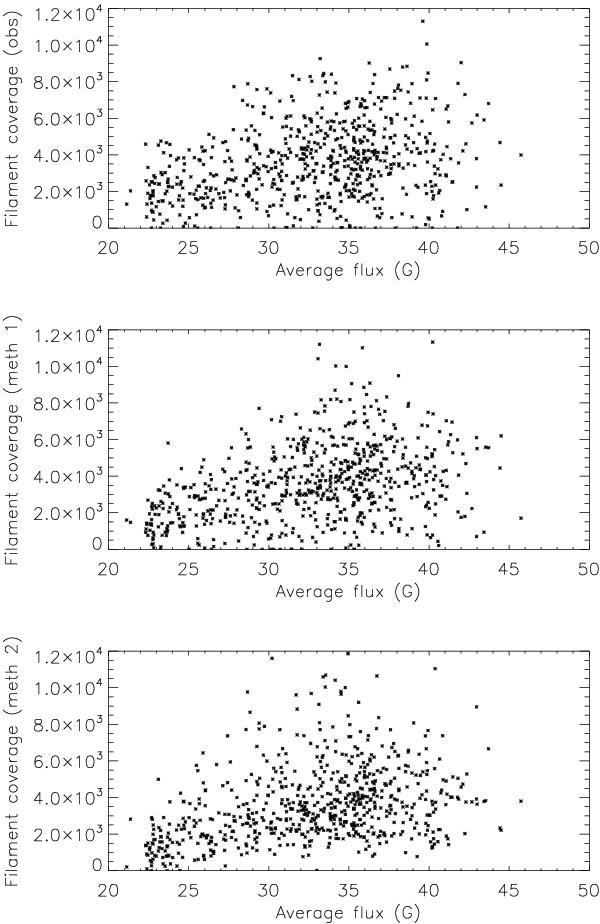
Upper panel: observed filament coverage (in ppm of the solar hemisphere) versus the average flux. Middle panel: same for reconstructed filament coverage  (first method, see text). Lower panel: same for reconstructed filament coverage
  (second method, see text).
Current usage metrics show cumulative count of Article Views (full-text article views including HTML views, PDF and ePub downloads, according to the available data) and Abstracts Views on Vision4Press platform.
Data correspond to usage on the plateform after 2015. The current usage metrics is available 48-96 hours after online publication and is updated daily on week days.
Initial download of the metrics may take a while.