Fig. 8
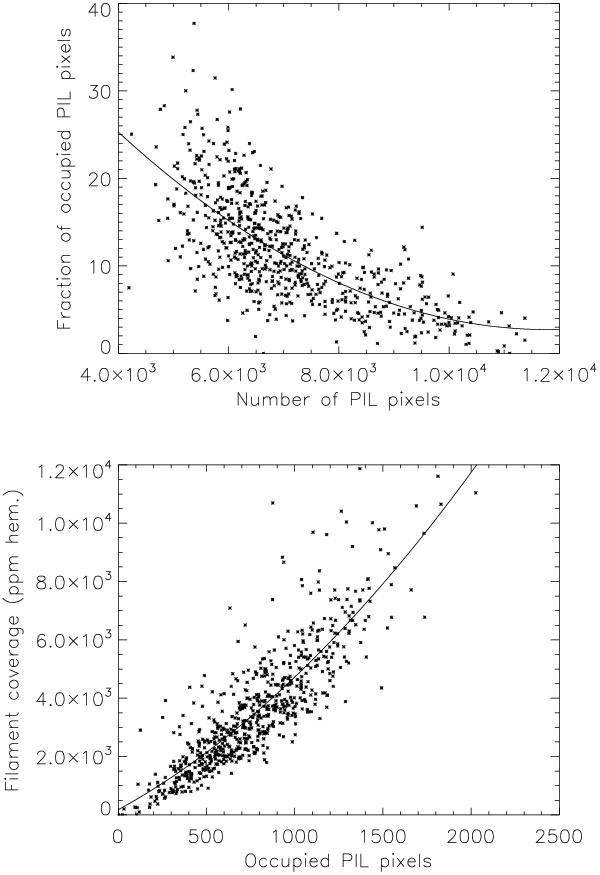
Upper panel: percentage of occupied pixels (distance to a filament smaller than 30 Mm) versus the number of PIL pixels. Each dot corresponds to a daily value. The solid line is a second degree polynomial fit on the 676 points. Lower panel: filament coverage (in ppm of the solar hemisphere) versus the number of occupied pixels (distance to a filament smaller than 30 Mm). The solid line is a second degree polynomial fit to the 676 points.
Current usage metrics show cumulative count of Article Views (full-text article views including HTML views, PDF and ePub downloads, according to the available data) and Abstracts Views on Vision4Press platform.
Data correspond to usage on the plateform after 2015. The current usage metrics is available 48-96 hours after online publication and is updated daily on week days.
Initial download of the metrics may take a while.