Fig. 6
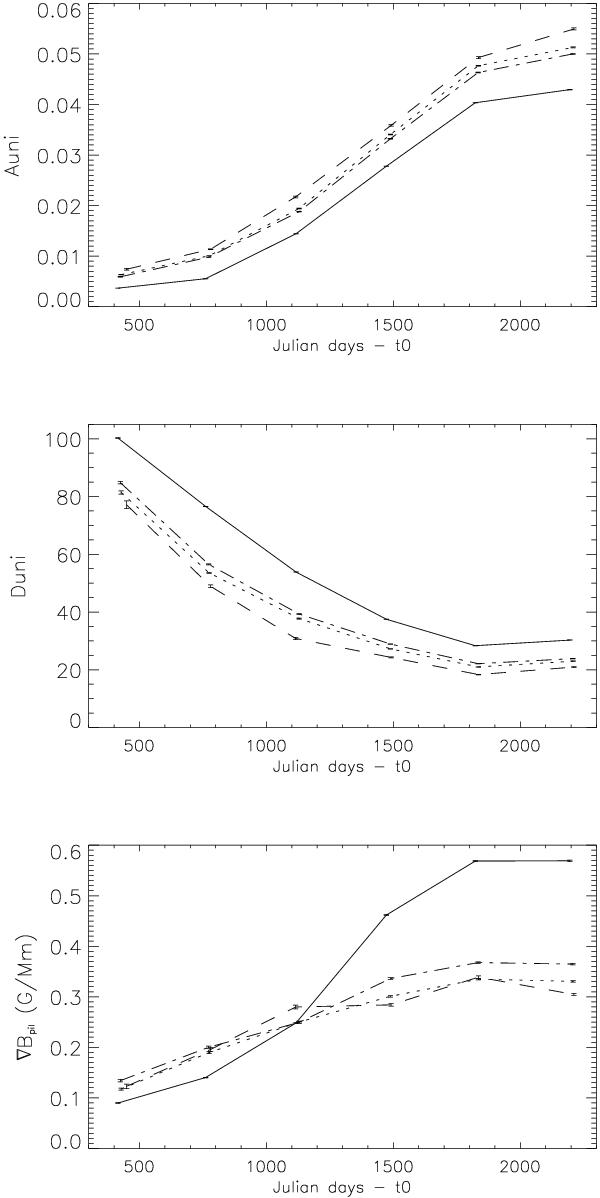
Upper panel: Auni versus time (Julian days minus t0 = 2 450 000) for all PIL pixels (solid line), pixels superimposed on filaments (dashed line), pixels at distances of smaller than 30 Mm from a filament (dotted line), pixels at distance smaller than 50 Mm from a filament (dashed-dotted line). Averages are computed over 1 year periods. The minimum activity period correspond to the left of the curves, and the maximum activity period to the right. Middle panel: same for Duni. Lower panel: same for ∇Bpil.
Current usage metrics show cumulative count of Article Views (full-text article views including HTML views, PDF and ePub downloads, according to the available data) and Abstracts Views on Vision4Press platform.
Data correspond to usage on the plateform after 2015. The current usage metrics is available 48-96 hours after online publication and is updated daily on week days.
Initial download of the metrics may take a while.