Fig. 3
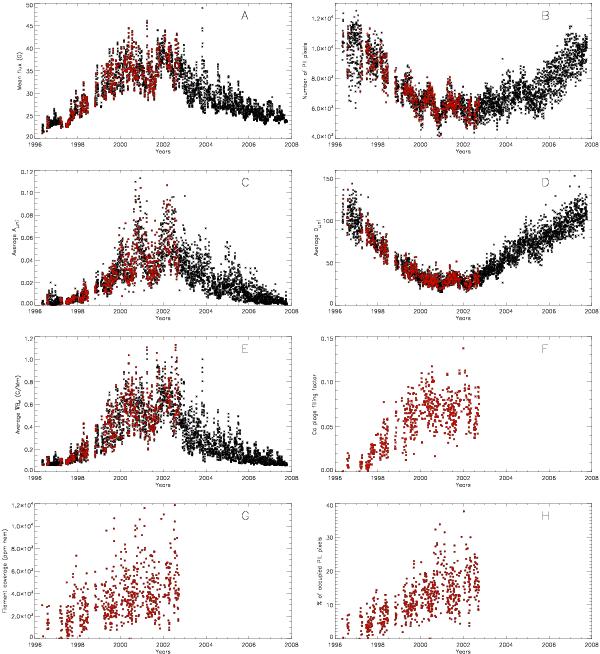
Panel A): average magnetic flux over the disk (daily values) versus time (years), in ppm of the solar hemisphere. Dots in red correspond to the time series studied in Sect. 4 (days for which we know the filament coverage) and dots in black correspond to the full time series studied in Sect. 5 (study of the magnetograms only). Panel B): same for the number of PIL pixels. Panel C): same for the average Auni. Panel D): same for the average Duni. Panel E): same for the average ∇Bpil. Panel F): same for the Ca plage filling factor (from Meunier & Delfosse 2009). Panel G): same for the surface coverage of the filaments, in ppm of the solar hemisphere. Panel H): same for the percentage of occupied PIL pixels, corresponding to PIL pixels that are at a distance smaller than 30 Mm from a filament.
Current usage metrics show cumulative count of Article Views (full-text article views including HTML views, PDF and ePub downloads, according to the available data) and Abstracts Views on Vision4Press platform.
Data correspond to usage on the plateform after 2015. The current usage metrics is available 48-96 hours after online publication and is updated daily on week days.
Initial download of the metrics may take a while.