Free Access
Fig. 2
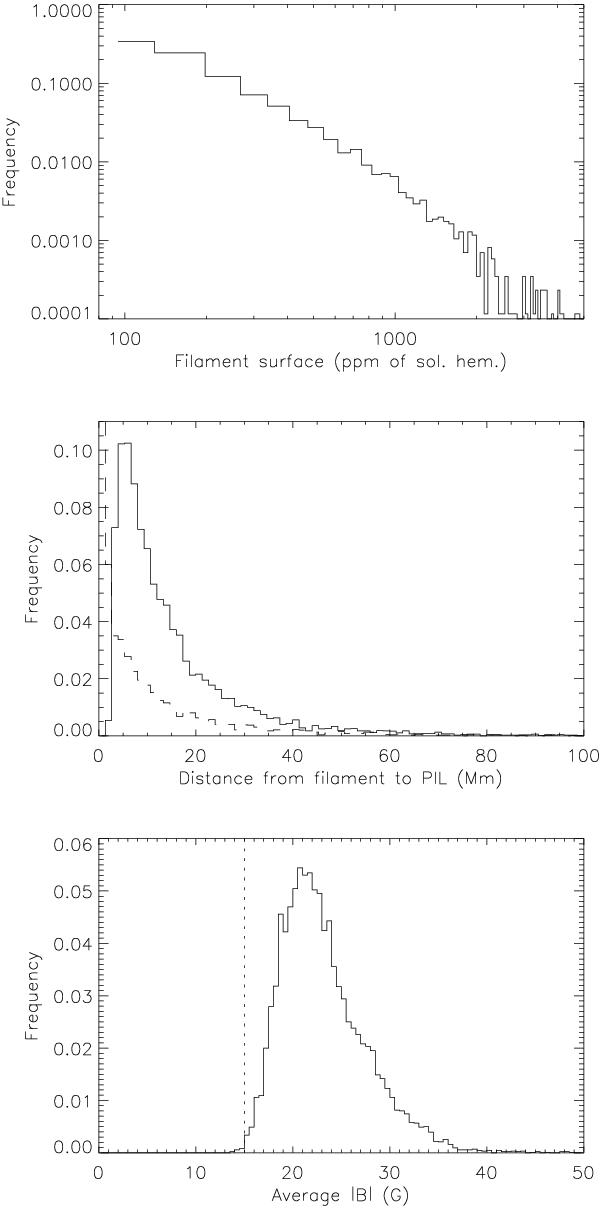
Upper panel: surface distribution of filaments (ppm of the solar hemisphere). Middle panel: distribution of the average distance from filament to PIL  , in Mm (solid line) and of the closest distance Dpil (dashed line). Lower panel: distribution of the magnetic field (absolute value) averaged over each filament (G).
Current usage metrics show cumulative count of Article Views (full-text article views including HTML views, PDF and ePub downloads, according to the available data) and Abstracts Views on Vision4Press platform.
Data correspond to usage on the plateform after 2015. The current usage metrics is available 48-96 hours after online publication and is updated daily on week days.
Initial download of the metrics may take a while.