Fig. 1
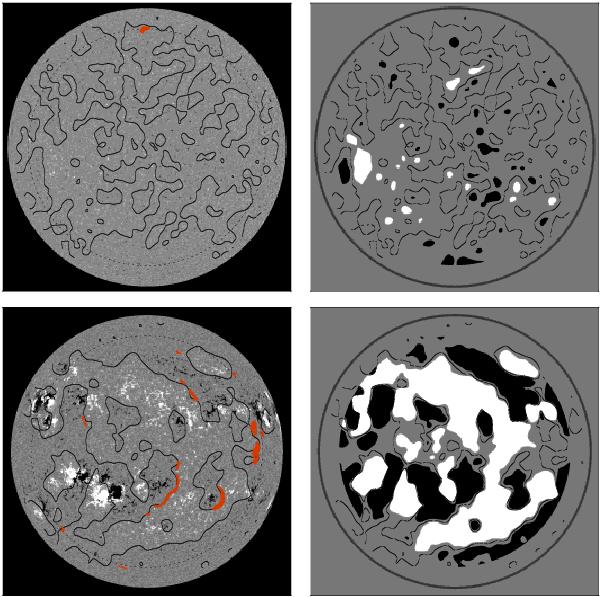
Upper left panel: example of a full sun magnetogram during a low activity period, with PIL pixels superimposed (solid line) and filaments (red patches). The dotted circle indicates a distance of 0.85 R⊙. Upper right panel: for the same magnetogram, positive polarity (white) and negative polarity (black) unipolar areas (see text for more details) are superimposed on the PIL (dotted line). The gray circle indicates the position of the limb. Lower panels: same as upper panels but for a high activity period.
Current usage metrics show cumulative count of Article Views (full-text article views including HTML views, PDF and ePub downloads, according to the available data) and Abstracts Views on Vision4Press platform.
Data correspond to usage on the plateform after 2015. The current usage metrics is available 48-96 hours after online publication and is updated daily on week days.
Initial download of the metrics may take a while.