Fig. 6
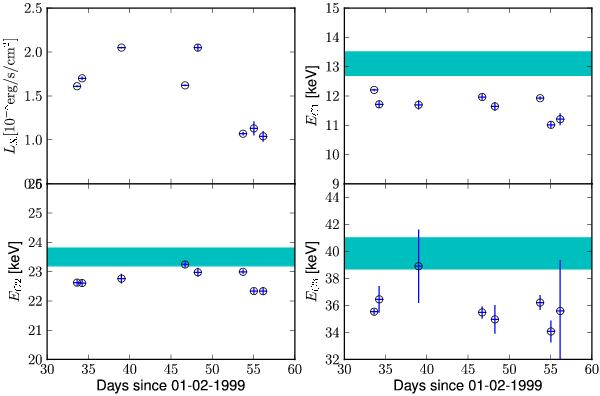
Phase-averaged luminosity and centroid energy of the absorption lines. The horizontal cyan bands are the energy range of the most negative phase shift of the main peak measured from the BeppoSAX data. Uncertainties on fitted parameters are at 90% c.l. Upper left: X-ray luminosity (see Table 1). Upper right: centroid energy of the fundamental. Lower left: centroid energy of the first harmonic. Lower right: centroid energy of the second harmonic.
Current usage metrics show cumulative count of Article Views (full-text article views including HTML views, PDF and ePub downloads, according to the available data) and Abstracts Views on Vision4Press platform.
Data correspond to usage on the plateform after 2015. The current usage metrics is available 48-96 hours after online publication and is updated daily on week days.
Initial download of the metrics may take a while.