Fig. 6
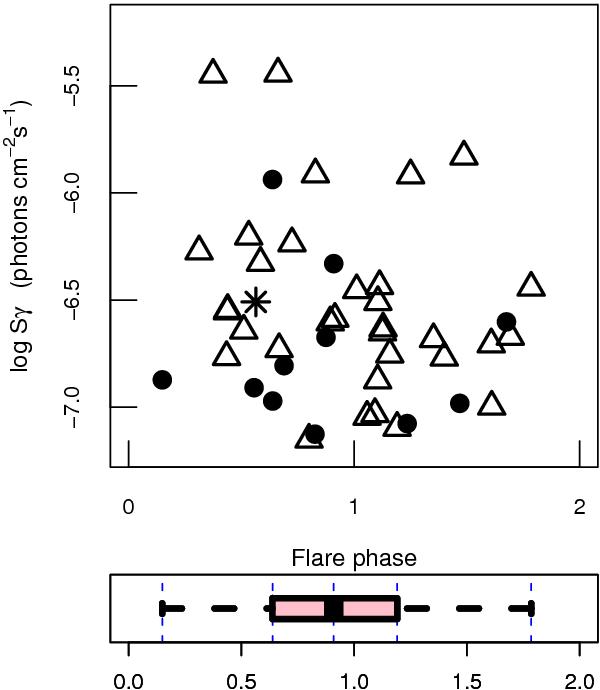
The maximum γ-ray flux density versus the radio flare phase (0, beginning; 1 peak; 2 end of the flare). The bottom panel shows the distribution of the flare phases in a boxplot, with the median located at early stages of the flare. Quasars, BLLacs, and radio-galaxies are shown by triangles, circles, and asterisks, respectively.
Current usage metrics show cumulative count of Article Views (full-text article views including HTML views, PDF and ePub downloads, according to the available data) and Abstracts Views on Vision4Press platform.
Data correspond to usage on the plateform after 2015. The current usage metrics is available 48-96 hours after online publication and is updated daily on week days.
Initial download of the metrics may take a while.