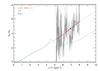
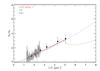
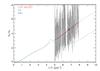
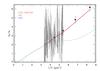
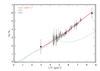
Fig. A.2
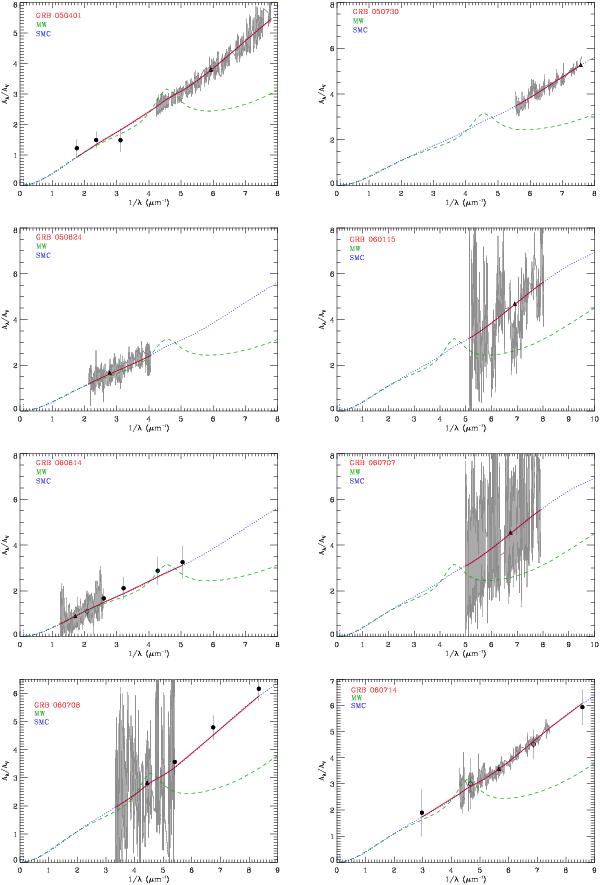
Absolute extinction curves of the spectroscopic GRB sample. The extinction curves are based on the best fit models given in Table 2. The grey curve represents the optical spectrum. The black triangles correspond to acquisition camera photometry used for scaling the afterglow SED. Black open circles are not included in the spectral fitting because of the optical spectrum wavelength coverage in that region while solid circles represents the photometric data points included in the SED modeling. The red solid curve corresponds to the best dust model for each GRB. Also shown are the Milky Way (green dashed line) and SMC (blue dotted line) extinction models taken from Pei (1992).
Current usage metrics show cumulative count of Article Views (full-text article views including HTML views, PDF and ePub downloads, according to the available data) and Abstracts Views on Vision4Press platform.
Data correspond to usage on the plateform after 2015. The current usage metrics is available 48-96 hours after online publication and is updated daily on week days.
Initial download of the metrics may take a while.