Fig. 10
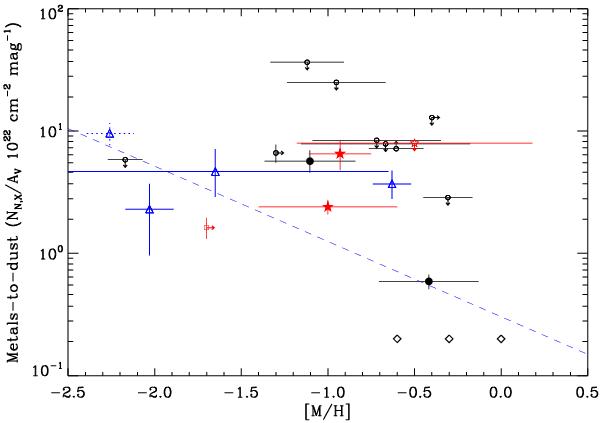
Metals-to-dust ratio versus metallicity for the GRB sub-sample. The metallicities based on Zn are marked with red stars. The black circles represent Si-derived metallicity (see Table 6). GRB 080607 is marked by a red square. The small circles and stars illustrate metallicity or metals-to-dust ratio upper limits. MW, LMC and SMC environments are denoted with diamonds from right to left. The blue triangles correspond to four data points taken from Schady et al. (2010). The blue dashed line represents the best fit to the three Local Group environments and the four GRBs from Schady et al. (2010). The blue triangle with dotted error bars is GRB 050730 which is also included in both Schady et al. (2010) and our sample.
Current usage metrics show cumulative count of Article Views (full-text article views including HTML views, PDF and ePub downloads, according to the available data) and Abstracts Views on Vision4Press platform.
Data correspond to usage on the plateform after 2015. The current usage metrics is available 48-96 hours after online publication and is updated daily on week days.
Initial download of the metrics may take a while.