Fig. 2
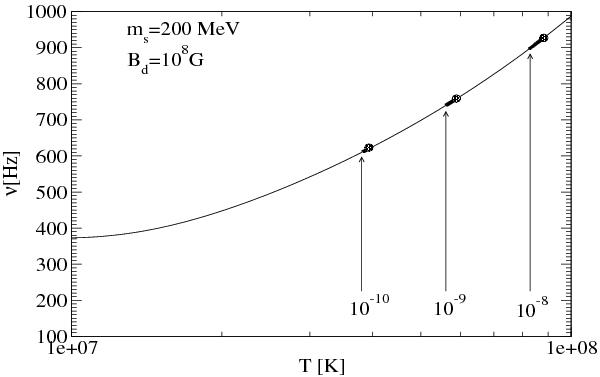
Instability window and trajectories of the evolution of the frequency and temperature of the star for different values of the mass accretion rate. The short thick lines represent the paths followed by the star after the instability window is touched. The dots indicate the onset of the Tayler instability at which the evolution is stopped.
Current usage metrics show cumulative count of Article Views (full-text article views including HTML views, PDF and ePub downloads, according to the available data) and Abstracts Views on Vision4Press platform.
Data correspond to usage on the plateform after 2015. The current usage metrics is available 48-96 hours after online publication and is updated daily on week days.
Initial download of the metrics may take a while.