Fig. 4
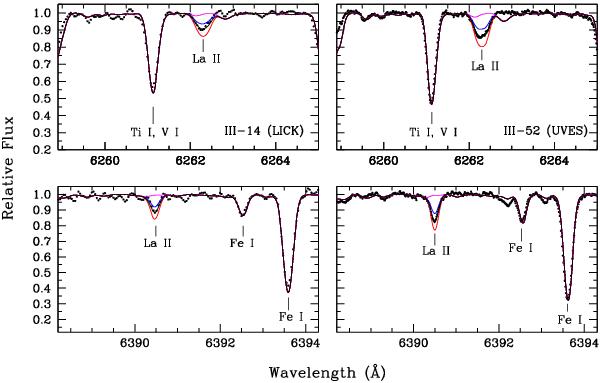
Observed and synthetic spectra around the La lines at 6262 Å and 6390 Å for the s-poor star III-14 observed at LICK (left panels), and the s-rich star III-52 observed with UVES (right panels). In each panel the points represent the observed spectrum. The magenta line is the spectrum computed with no contribution from La ii; the black line is the best-fitting synthesis (with the La abundance given in Table 6); and the red and blue lines are the syntheses computed with La abundances altered by ± 0.2 dex from the best value.
Current usage metrics show cumulative count of Article Views (full-text article views including HTML views, PDF and ePub downloads, according to the available data) and Abstracts Views on Vision4Press platform.
Data correspond to usage on the plateform after 2015. The current usage metrics is available 48-96 hours after online publication and is updated daily on week days.
Initial download of the metrics may take a while.