Fig. 8
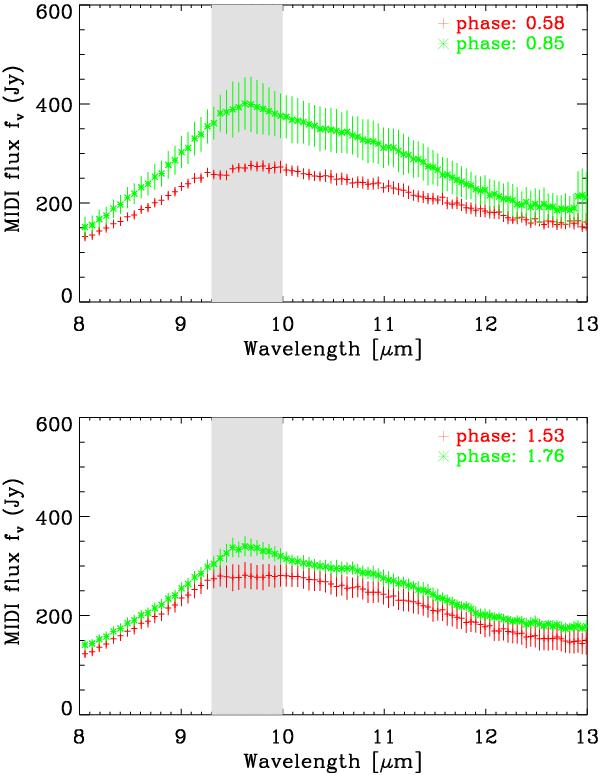
Calibrated MIDI flux spectrum for different pulsation phases within the same cycle to investigate intracycle photometry variations. Each line represents a different pulsation phase within the same cycle and is computed as an average of data obtained at the respective phase ( ± 0.15). The top panel shows the example of pulsation phases 0.58 and 0.85 of cycle zero. The bottom panel shows the examples of phases 0.53 and 0.76 of cycle one. The error bars are computed as the standard deviation of the averaged photometry curves. The gray shades denote zones that are affected by atmospheric absorption.

Current usage metrics show cumulative count of Article Views (full-text article views including HTML views, PDF and ePub downloads, according to the available data) and Abstracts Views on Vision4Press platform.
Data correspond to usage on the plateform after 2015. The current usage metrics is available 48-96 hours after online publication and is updated daily on week days.
Initial download of the metrics may take a while.