Fig. 7
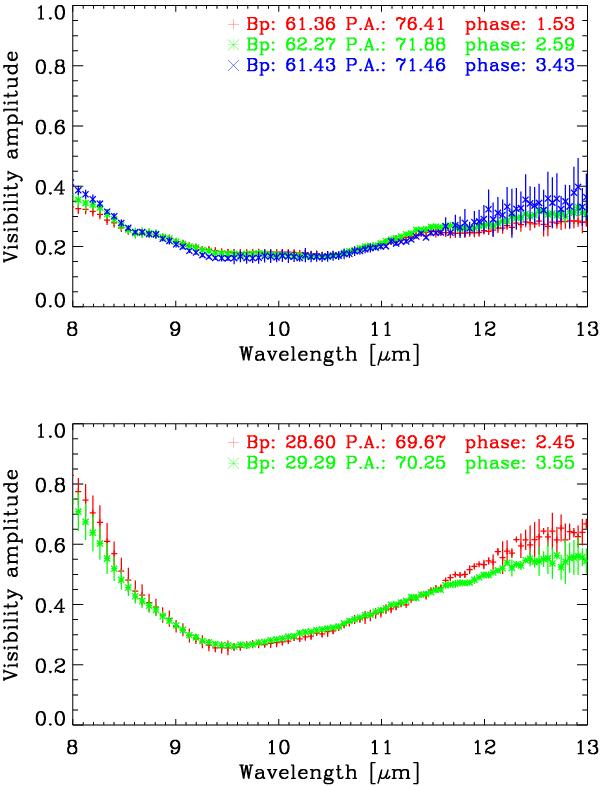
As for Fig. 6, but for the same pulsation phase in consecutive pulsation cycles to investigate cycle-to-cycle visibility variations. The top panel shows the example of pulsation phase ~0.5 in three consecutive cycles observed with a projected baseline length of ~61 m and a position angle ~75 deg. The bottom panel shows the example of pulsation phase 0.5 in two consecutive cycles observed with a projected baseline length of ~29 m and a position angle ~70 deg.
Current usage metrics show cumulative count of Article Views (full-text article views including HTML views, PDF and ePub downloads, according to the available data) and Abstracts Views on Vision4Press platform.
Data correspond to usage on the plateform after 2015. The current usage metrics is available 48-96 hours after online publication and is updated daily on week days.
Initial download of the metrics may take a while.