Fig. 6
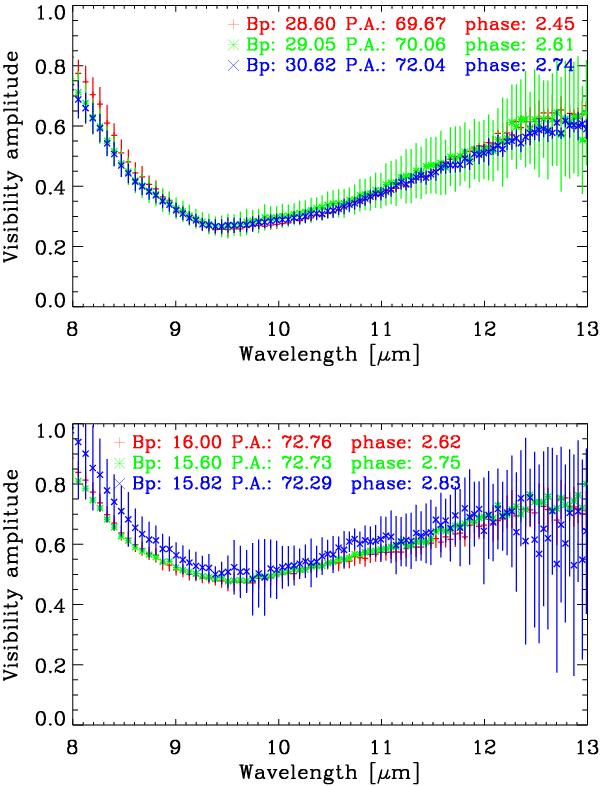
Calibrated MIDI visibility amplitudes for different pulsation phases within the same cycle to investigate intracycle visibility variations. Each line represents a different pulsation phase within the same cycle and is computed as an average of data obtained at the respective phase ( ± 0.15) and observed at similar projected baseline length (Bp ± 10%) and position angle (PA ± 10%). The top panel shows the example of pulsation phases 0.45, 0.61, and 0.74 of cycle two observed with a projected baseline length of ~29 m and a position angle of ~70 deg. The bottom panel shows the example of pulsation phases 0.62, 0.75, and 0.83 of cycle two observed with a projected baseline length of ~16 m and a position angle of ~72 deg. The error bars are computed as the standard deviation of the averaged visibilities.
Current usage metrics show cumulative count of Article Views (full-text article views including HTML views, PDF and ePub downloads, according to the available data) and Abstracts Views on Vision4Press platform.
Data correspond to usage on the plateform after 2015. The current usage metrics is available 48-96 hours after online publication and is updated daily on week days.
Initial download of the metrics may take a while.