Fig. 3
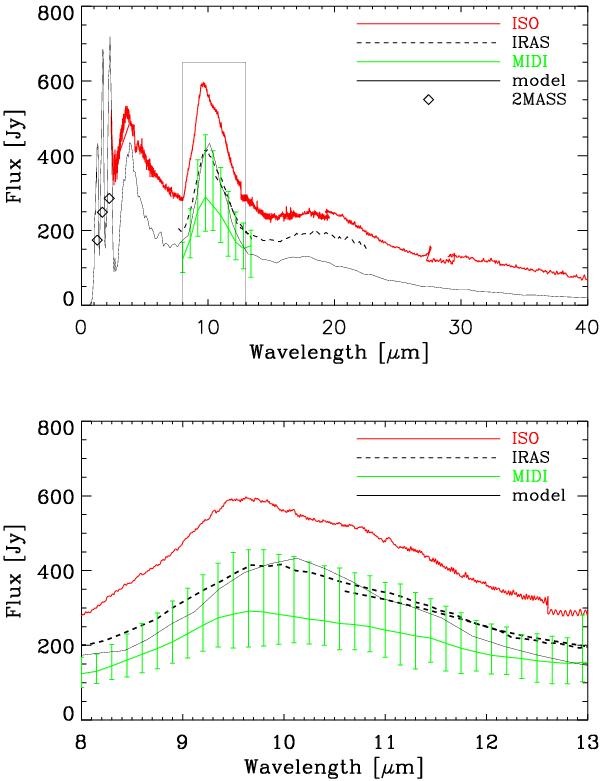
RR Aql flux spectrum as a function of wavelength from 2.4 μm to 40 μm (top). The lines represent the flux spectra from ISO-SWS observations covering wavelengths from 2.5 μm to ~240 μm (solid red thick line), IRAS-LRS observations covering ~7.7 μm to ~23 μm (dashed thin black line), and the mean of our N-band MIDI measurements (solid thin green line). Here, the vertical bars span the maximum and minimum values measured. The diamonds denote 2MASS measurements at 1.25 μm, 1.65 μm, and 2.2 μm. The solid black line indicates our atmosphere and dust shell model as explained in Sect. 5.2. The bottom plot shows an enlarged segment of the plot in the MIDI wavelength range of 8–13 μm.
Current usage metrics show cumulative count of Article Views (full-text article views including HTML views, PDF and ePub downloads, according to the available data) and Abstracts Views on Vision4Press platform.
Data correspond to usage on the plateform after 2015. The current usage metrics is available 48-96 hours after online publication and is updated daily on week days.
Initial download of the metrics may take a while.