Fig. 11
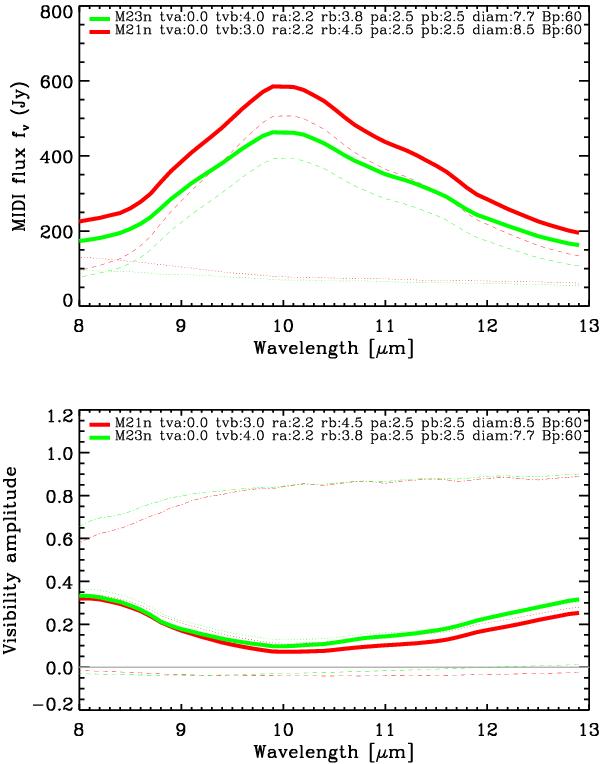
Simulation 2. Like simulation 1 in Fig. 10, but for the parameters of simulation 2 comparing a post-maximum atmosphere model and a minimum model as in simulation 1, but where the dust is also assumed to be closer to the star with larger optical depth at minimum phase and farther from the star with lower optical depth at post-maximum phase.
Current usage metrics show cumulative count of Article Views (full-text article views including HTML views, PDF and ePub downloads, according to the available data) and Abstracts Views on Vision4Press platform.
Data correspond to usage on the plateform after 2015. The current usage metrics is available 48-96 hours after online publication and is updated daily on week days.
Initial download of the metrics may take a while.