Fig. 1
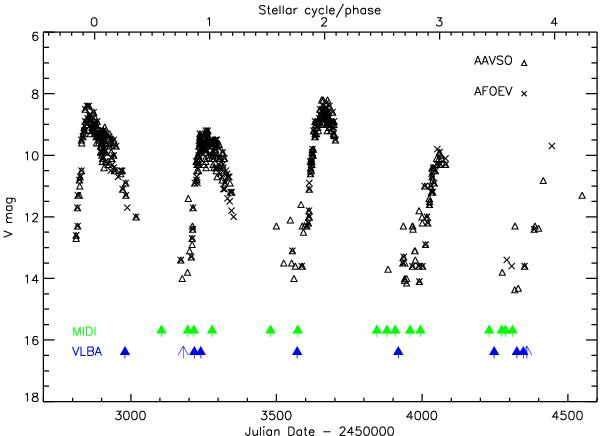
Visual light curve of RR Aql based on data from the AAVSO and AFOEV databases as a function of Julian Date and stellar cycle/phase. The green arrows indicate the dates of our VLTI/MIDI observations. The blue arrows indicate the dates of our VLBA observations. Here, the full arrows denote observations of SiO maser emission and simple arrows observations of H2O maser emission.
Current usage metrics show cumulative count of Article Views (full-text article views including HTML views, PDF and ePub downloads, according to the available data) and Abstracts Views on Vision4Press platform.
Data correspond to usage on the plateform after 2015. The current usage metrics is available 48-96 hours after online publication and is updated daily on week days.
Initial download of the metrics may take a while.