Fig. 8
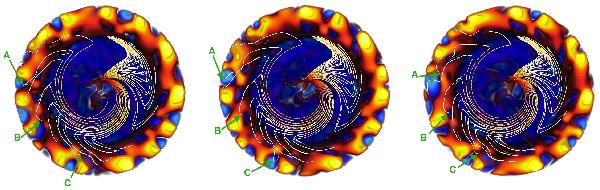
Three-dimensional views from the north pole. The left picture corresponds to Fig. 7c, and the two following snapshots are taken 2 and 4 days later. We reversed the color table of the field lines to emphasize their movement. The green arrows indicate the movement of three field lines during this period.
Current usage metrics show cumulative count of Article Views (full-text article views including HTML views, PDF and ePub downloads, according to the available data) and Abstracts Views on Vision4Press platform.
Data correspond to usage on the plateform after 2015. The current usage metrics is available 48-96 hours after online publication and is updated daily on week days.
Initial download of the metrics may take a while.