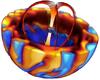
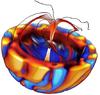
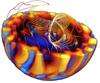
Fig. 7
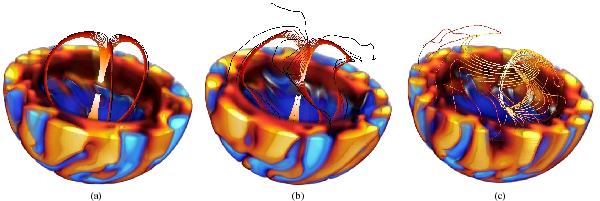
Three-dimensional views of the longitudinal velocity in the rotating frame. Red are the positive velocities, and blue the negative velocities. Picture a) is the initial time where we added the magnetic field, and picture b) is taken after two solar rotation periods. Picture c) is taken much later in the simulation, when the magnetic layer became stable. Colored lines are the magnetic field lines we constructed from only a few seed points to be able to distinguish them. Dark colors denote lower magnetic field intensity. Note that for the third image, we only put in seed points at one longitude value to distinguish the field lines that explore almost the entire ϕ domain in the radiation zone.
Current usage metrics show cumulative count of Article Views (full-text article views including HTML views, PDF and ePub downloads, according to the available data) and Abstracts Views on Vision4Press platform.
Data correspond to usage on the plateform after 2015. The current usage metrics is available 48-96 hours after online publication and is updated daily on week days.
Initial download of the metrics may take a while.