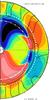
Fig. 6
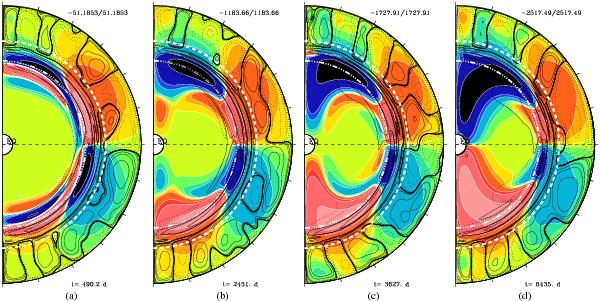
Poloidal snapshots of ⟨ Bϕ ⟩ (colored background) and instant meridional circulation (black lines). Initially, the magnetic field is purely poloidal. The first figure on the left is taken just after the beginning iteration (not the same time as in Fig. 5a) to demonstrate how the longitudinal magnetic field is primarily created. Red is the positive magnetic field, and blue the negative magnetic field. In order to display the azimuthal magnetic field in the radiation zone and the convection zone (where it is much weaker), a logarithmic scale was used for the color table. The two white lines indicate the base of the convection zone rbcz and the shear depth rshear (cf. Fig. 1c).
Current usage metrics show cumulative count of Article Views (full-text article views including HTML views, PDF and ePub downloads, according to the available data) and Abstracts Views on Vision4Press platform.
Data correspond to usage on the plateform after 2015. The current usage metrics is available 48-96 hours after online publication and is updated daily on week days.
Initial download of the metrics may take a while.