Fig. 4
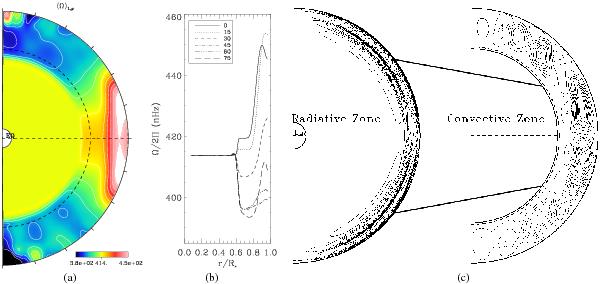
a) Azimuthally and temporally averaged rotation frequency. Yellow denotes the rotation rate of the interior, red is the higher rotation rate and blue the lower rotation rate. b) Radial profile of rotation frequency at different latitudes. c) Meridional circulation in the radiation zone (left) and in the convection zone (right), evaluated from the poloidal mass flux averaged over time and longitude. Solid contours denote counterclockwise circulation, dashed contours clockwise circulation.
Current usage metrics show cumulative count of Article Views (full-text article views including HTML views, PDF and ePub downloads, according to the available data) and Abstracts Views on Vision4Press platform.
Data correspond to usage on the plateform after 2015. The current usage metrics is available 48-96 hours after online publication and is updated daily on week days.
Initial download of the metrics may take a while.