Fig. 13
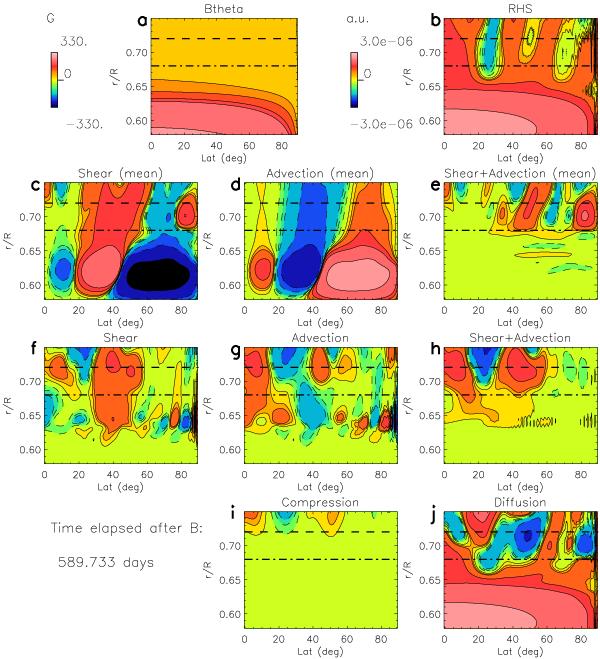
Major terms of production of ⟨ Bθ ⟩ . The abscissa spans the northern hemisphere, the ordinate is a zoom in the tachocline. The left color bar corresponds to instantaneous ⟨ Bθ ⟩ , while the right color bar stands for the nine other panels. The RHS panel is the sum of the panels e), h), j), and i), and represents the net evolution of the mean latitudinal magnetic field. Panels c, d), f), g), i), and j) correspond to PMS, PMA, PFS, PFA, PC, and PMD, respectively (see Eq. (12)). The panels e and h correspond to the sum of panels c) and d), and f) and g), respectively. Color levels are not linear in order to see at the same time the contributions of the terms in the different regions. Red colors denote the positive contribution to the magnetic field and blue colors the negative contributions. The two horizontal lines in each panel represent rbcz (dash) and rMC (dot-dash), as in Fig. 1c.
Current usage metrics show cumulative count of Article Views (full-text article views including HTML views, PDF and ePub downloads, according to the available data) and Abstracts Views on Vision4Press platform.
Data correspond to usage on the plateform after 2015. The current usage metrics is available 48-96 hours after online publication and is updated daily on week days.
Initial download of the metrics may take a while.