Fig. 12
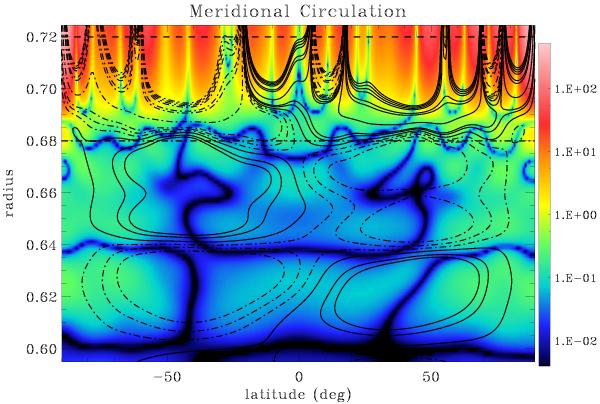
Zoom of the time-averaged meridional circulation pattern before the introduction of the magnetic field in the tachocline area. The stream function is plotted in iso-contours, solid lines denoting clockwise circulation profiles, and dotted lines anti-clockwise. The background color map corresponds to the rms strength of the meridional circulation flow in m s-1 with a logarithmic scale. Red colors denote the strongest downflows.
Current usage metrics show cumulative count of Article Views (full-text article views including HTML views, PDF and ePub downloads, according to the available data) and Abstracts Views on Vision4Press platform.
Data correspond to usage on the plateform after 2015. The current usage metrics is available 48-96 hours after online publication and is updated daily on week days.
Initial download of the metrics may take a while.