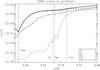
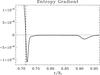
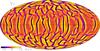
Fig. 1
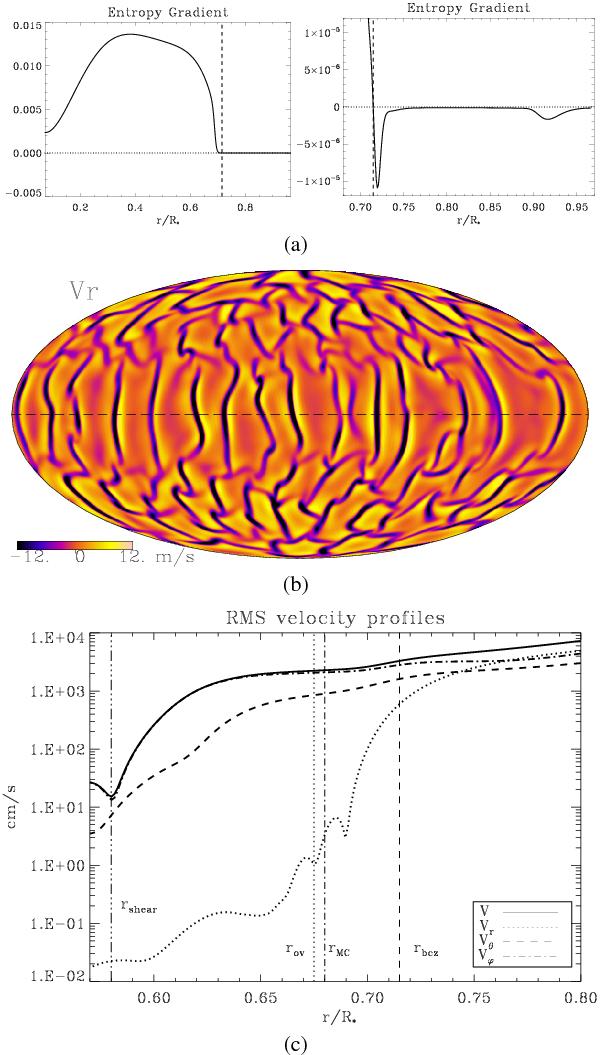
a) Mean entropy gradient profile and zoom in the region where the entropy gradient changes sign. Entropy gradients are plotted in erg g-1 K-1 cm-1. b) Radial velocity on a spherical shell near the top of the convection zone (0.96 R⊙). Dark colors represent the downflows, while bright-yellow colors denote the upflows. c) rms velocities profiles at the interface between radiative and convective zones. The four vertical bars label the base of the convection zone (where the entropy gradient changes sign), the penetration depth of meridional circulation, the overshooting depth of convective motions, and the shear depth where differential rotation vanishes.
Current usage metrics show cumulative count of Article Views (full-text article views including HTML views, PDF and ePub downloads, according to the available data) and Abstracts Views on Vision4Press platform.
Data correspond to usage on the plateform after 2015. The current usage metrics is available 48-96 hours after online publication and is updated daily on week days.
Initial download of the metrics may take a while.