Fig. 2
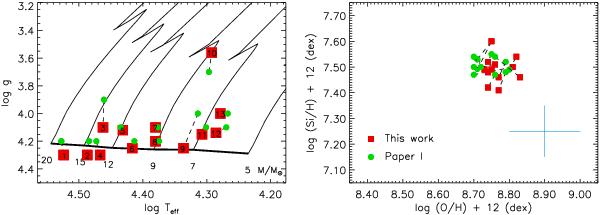
Comparison of effective temperature and surface gravities (left panel) and oxygen and silicon abundances (right panel) derived in Paper I with Fastwind and the present work with Atlas+Detail+Surface. Evolutionary tracks (corresponding to Z = 0.02) are extracted from Schaller et al. (1992). Numbers in the left panel identify the stars, as in Table 3. The blue cross in the right panel indicates the typical uncertainties in the O and Si abundances derived from individual analyses.
Current usage metrics show cumulative count of Article Views (full-text article views including HTML views, PDF and ePub downloads, according to the available data) and Abstracts Views on Vision4Press platform.
Data correspond to usage on the plateform after 2015. The current usage metrics is available 48-96 hours after online publication and is updated daily on week days.
Initial download of the metrics may take a while.