Fig. 5
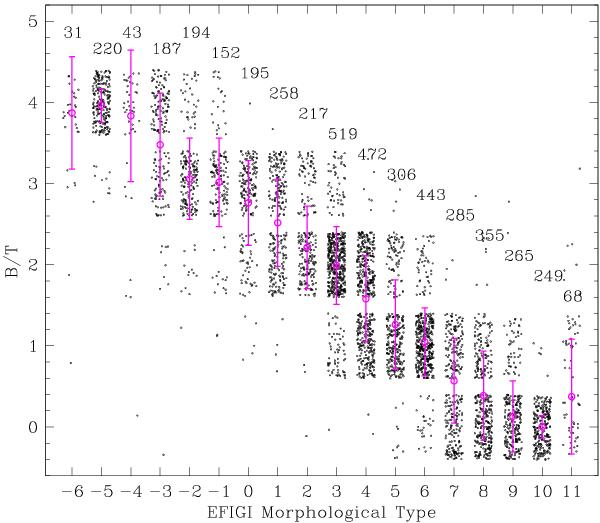
Distribution of B/T attribute versus the EFIGI morphological type for the 4458 galaxies in the EFIGI catalogue (see Table 2 for the correspondence with types). In order to see the relative density of data points, they are spread in the horizontal and vertical direction, hence the apparent rectangles. The weighted mean and weighted rms dispersion in B/T are also plotted for each type along with the corresponding number of galaxies. This graph shows the strong correlation of morphological type with B/T.
Current usage metrics show cumulative count of Article Views (full-text article views including HTML views, PDF and ePub downloads, according to the available data) and Abstracts Views on Vision4Press platform.
Data correspond to usage on the plateform after 2015. The current usage metrics is available 48-96 hours after online publication and is updated daily on week days.
Initial download of the metrics may take a while.